Allstate 2012 Annual Report Download - page 4
Download and view the complete annual report
Please find page 4 of the 2012 Allstate annual report below. You can navigate through the pages in the report by either clicking on the pages listed below, or by using the keyword search tool below to find specific information within the annual report.-
 1
1 -
 2
2 -
 3
3 -
 4
4 -
 5
5 -
 6
6 -
 7
7 -
 8
8 -
 9
9 -
 10
10 -
 11
11 -
 12
12 -
 13
13 -
 14
14 -
 15
15 -
 16
16 -
 17
17 -
 18
18 -
 19
19 -
 20
20 -
 21
21 -
 22
22 -
 23
23 -
 24
24 -
 25
25 -
 26
26 -
 27
27 -
 28
28 -
 29
29 -
 30
30 -
 31
31 -
 32
32 -
 33
33 -
 34
34 -
 35
35 -
 36
36 -
 37
37 -
 38
38 -
 39
39 -
 40
40 -
 41
41 -
 42
42 -
 43
43 -
 44
44 -
 45
45 -
 46
46 -
 47
47 -
 48
48 -
 49
49 -
 50
50 -
 51
51 -
 52
52 -
 53
53 -
 54
54 -
 55
55 -
 56
56 -
 57
57 -
 58
58 -
 59
59 -
 60
60 -
 61
61 -
 62
62 -
 63
63 -
 64
64 -
 65
65 -
 66
66 -
 67
67 -
 68
68 -
 69
69 -
 70
70 -
 71
71 -
 72
72 -
 73
73 -
 74
74 -
 75
75 -
 76
76 -
 77
77 -
 78
78 -
 79
79 -
 80
80 -
 81
81 -
 82
82 -
 83
83 -
 84
84 -
 85
85 -
 86
86 -
 87
87 -
 88
88 -
 89
89 -
 90
90 -
 91
91 -
 92
92 -
 93
93 -
 94
94 -
 95
95 -
 96
96 -
 97
97 -
 98
98 -
 99
99 -
 100
100 -
 101
101 -
 102
102 -
 103
103 -
 104
104 -
 105
105 -
 106
106 -
 107
107 -
 108
108 -
 109
109 -
 110
110 -
 111
111 -
 112
112 -
 113
113 -
 114
114 -
 115
115 -
 116
116 -
 117
117 -
 118
118 -
 119
119 -
 120
120 -
 121
121 -
 122
122 -
 123
123 -
 124
124 -
 125
125 -
 126
126 -
 127
127 -
 128
128 -
 129
129 -
 130
130 -
 131
131 -
 132
132 -
 133
133 -
 134
134 -
 135
135 -
 136
136 -
 137
137 -
 138
138 -
 139
139 -
 140
140 -
 141
141 -
 142
142 -
 143
143 -
 144
144 -
 145
145 -
 146
146 -
 147
147 -
 148
148 -
 149
149 -
 150
150 -
 151
151 -
 152
152 -
 153
153 -
 154
154 -
 155
155 -
 156
156 -
 157
157 -
 158
158 -
 159
159 -
 160
160 -
 161
161 -
 162
162 -
 163
163 -
 164
164 -
 165
165 -
 166
166 -
 167
167 -
 168
168 -
 169
169 -
 170
170 -
 171
171 -
 172
172 -
 173
173 -
 174
174 -
 175
175 -
 176
176 -
 177
177 -
 178
178 -
 179
179 -
 180
180 -
 181
181 -
 182
182 -
 183
183 -
 184
184 -
 185
185 -
 186
186 -
 187
187 -
 188
188 -
 189
189 -
 190
190 -
 191
191 -
 192
192 -
 193
193 -
 194
194 -
 195
195 -
 196
196 -
 197
197 -
 198
198 -
 199
199 -
 200
200 -
 201
201 -
 202
202 -
 203
203 -
 204
204 -
 205
205 -
 206
206 -
 207
207 -
 208
208 -
 209
209 -
 210
210 -
 211
211 -
 212
212 -
 213
213 -
 214
214 -
 215
215 -
 216
216 -
 217
217 -
 218
218 -
 219
219 -
 220
220 -
 221
221 -
 222
222 -
 223
223 -
 224
224 -
 225
225 -
 226
226 -
 227
227 -
 228
228 -
 229
229 -
 230
230 -
 231
231 -
 232
232 -
 233
233 -
 234
234 -
 235
235 -
 236
236 -
 237
237 -
 238
238 -
 239
239 -
 240
240 -
 241
241 -
 242
242 -
 243
243 -
 244
244 -
 245
245 -
 246
246 -
 247
247 -
 248
248 -
 249
249 -
 250
250 -
 251
251 -
 252
252 -
 253
253 -
 254
254 -
 255
255 -
 256
256 -
 257
257 -
 258
258 -
 259
259 -
 260
260 -
 261
261 -
 262
262 -
 263
263 -
 264
264 -
 265
265 -
 266
266 -
 267
267 -
 268
268
 |
 |

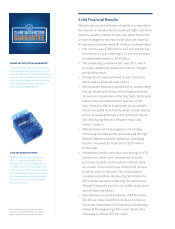
Solid Financial Results
Allstate achieved solid financial results in a year when
the insurance industry faced continued high costs from
extreme weather. While income was down from 2010
we still managed to increase book value per share by
4.5 percent and return nearly $1.4 billion to shareholders.
• Net income was $788 million, a 15 percent decline
from the prior year reflecting a 73 percent increase
in catastrophe losses to $3.8 billion.
• The underlying combined ratio* was 89.3, which
excludes catastrophe losses and reserve changes,
an excellent result.
• Strong returns were achieved in auto insurance
which had a combined ratio of 96.1.
• Homeowners insurance operated at an underwriting
loss as catastrophe losses utilized approximately
50 percent of premiums reflecting high catastrophe
losses in the second and third quarters of the
year. Proactive efforts to generate an acceptable
return on capital from this business include raising
prices, increasing the use of third-party products
and introducing the new Allstate House and
HomeSM product.
• Allstate Financial made progress in its strategy
of focusing on underwritten products sold through
Allstate Agencies and the workplace. Operating
income* improved by 11 percent to $529 million
for the year.
• Investment results were also very strong in 2011.
Investment yields were maintained from the
prior year despite continued low interest rates
as a result of tactical moves in the fixed income
portfolio early in the year. The consolidated
investment portfolio declined by $4.9 billion to
$95.6 billion primarily reflecting the reduction in
Allstate Financial’s portfolio as it shifts away from
spread-based products.
• Shareholders received dividends of $435 million
($0.83 per share) and $946 million of common
stock was repurchased (6 percent of outstanding
shares at the beginning of the year). Book value
increased to almost $37 per share.
CLAIM SATISFACTION GUARANTEESM
Under our Claim Satisfaction Guarantee,
any eligible standard auto customer who
is dissatisfied with the auto claim experi-
ence will receive a credit to his or her auto
policy (after notifying Allstate, in writing,
of the dissatisfaction and meeting all
other program requirements).
* For a definition of this term, please see the
“Definitions of Non-GAAP Measures” on the
second page following the proxy statement.
ALLSTATE INNOVATIONS
Allstate innovations include Drive
Wise®, a voluntary program that
rewards safe and low-mileage drivers
in eligible states with discounts of up
to 30 percent. In 2011, Allstate opened
its Insight, Design & Innovation Center
to help employees collaborate, design
solutions and discover fresh insights
about consumers.
