Allstate 2012 Annual Report Download - page 165
Download and view the complete annual report
Please find page 165 of the 2012 Allstate annual report below. You can navigate through the pages in the report by either clicking on the pages listed below, or by using the keyword search tool below to find specific information within the annual report.-
 1
1 -
2
-
3
-
4
-
5
-
6
-
7
-
8
-
9
-
10
-
11
-
12
-
13
-
14
-
15
-
16
-
17
-
18
-
19
-
20
-
21
-
22
-
23
-
24
-
25
-
26
-
27
-
28
-
29
-
30
-
31
-
32
-
33
-
34
-
35
-
36
-
37
-
38
-
39
-
40
-
41
-
42
-
43
-
44
-
45
-
46
-
47
-
48
-
49
-
50
-
51
-
52
-
53
-
54
-
55
-
56
-
57
-
58
-
59
-
60
-
61
-
62
-
63
-
64
-
65
-
66
-
67
-
68
-
69
-
70
-
71
-
72
-
73
-
74
-
75
-
76
-
77
-
78
-
79
-
80
-
81
-
82
-
83
-
84
-
85
-
86
-
87
-
88
-
89
-
90
-
91
-
92
-
93
-
94
-
95
-
96
-
97
-
98
-
99
-
100
-
101
-
102
-
103
-
104
-
105
-
106
-
107
-
108
-
109
-
110
-
111
-
112
-
113
-
114
-
115
-
116
-
117
-
118
-
119
-
120
-
121
-
122
-
123
-
124
-
125
-
126
-
127
-
128
-
129
-
130
-
131
-
132
-
133
-
134
-
135
-
136
-
137
-
138
-
139
-
140
-
141
-
142
-
143
-
144
-
145
-
146
-
147
-
148
-
149
-
150
-
151
-
152
-
153
-
154
-
 155
155 -
 156
156 -
 157
157 -
 158
158 -
 159
159 -
 160
160 -
 161
161 -
 162
162 -
 163
163 -
 164
164 -
 165
165 -
 166
166 -
 167
167 -
 168
168 -
 169
169 -
 170
170 -
 171
171 -
 172
172 -
 173
173 -
 174
174 -
 175
175 -
176
-
177
-
178
-
179
-
180
-
181
-
182
-
183
-
184
-
185
-
186
-
187
-
188
-
189
-
190
-
191
-
192
-
193
-
194
-
195
-
196
-
197
-
198
-
199
-
200
-
201
-
202
-
203
-
204
-
205
-
206
-
207
-
208
-
209
-
210
-
211
-
212
-
213
-
214
-
215
-
216
-
217
-
218
-
219
-
220
-
221
-
222
-
223
-
224
-
225
-
226
-
227
-
228
-
229
-
230
-
231
-
232
-
233
-
234
-
235
-
236
-
237
-
238
-
239
-
240
-
241
-
242
-
243
-
244
-
245
-
246
-
247
-
248
-
249
-
250
-
251
-
252
-
253
-
254
-
255
-
256
-
257
-
258
-
259
-
260
-
261
-
262
-
263
-
264
-
265
-
266
-
267
-
268
 |
 |

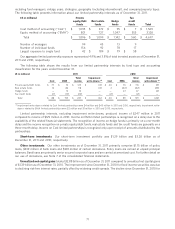
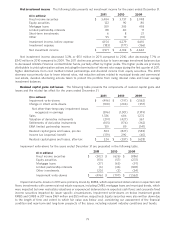
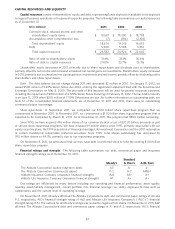
Net investment income The following table presents net investment income for the years ended December 31.
2011 2010 2009
($ in millions)
Fixed income securities $ 3,484 $ 3,737 $ 3,998
Equity securities 122 90 80
Mortgage loans 359 385 498
Limited partnership interests 88 40 17
Short-term investments 6 8 27
Other 95 19 (10)
Investment income, before expense 4,154 4,279 4,610
Investment expense (183) (177) (166)
Net investment income $ 3,971 $ 4,102 $ 4,444
Net investment income decreased 3.2% or $131 million in 2011 compared to 2010, after decreasing 7.7% or
$342 million in 2010 compared to 2009. The 2011 decline was primarily due to lower average investment balances due
to decreased Allstate Financial contractholder funds, partially offset by higher yields. The higher yields are primarily
attributable to yield optimization actions including the termination of interest rate swaps during the first quarter of 2011,
higher distributions from cost method limited partnerships and dividend income from equity securities. The 2010
decrease was primarily due to lower interest rates, risk reduction actions related to municipal bonds and commercial
real estate, duration shortening actions taken to protect the portfolio from rising interest rates and lower average
investment balances.
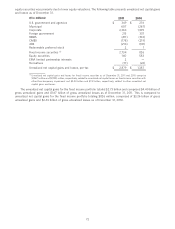
Realized capital gains and losses The following table presents the components of realized capital gains and
losses and the related tax effect for the years ended December 31.
2011 2010 2009
($ in millions)
Impairment write-downs $ (496) $ (797) $ (1,562)
Change in intent write-downs (100) (204) (357)
Net other-than-temporary impairment losses
recognized in earnings (596) (1,001) (1,919)
Sales 1,336 686 1,272
Valuation of derivative instruments (291) (427) 367
Settlements of derivative instruments (105) (174) (162)
EMA limited partnership income 159 89 (141)
Realized capital gains and losses, pre-tax 503 (827) (583)
Income tax (expense) benefit (179) 290 (45)
Realized capital gains and losses, after-tax $ 324 $ (537) $ (628)
Impairment write-downs for the years ended December 31 are presented in the following table.
2011 2010 2009
($ in millions)
Fixed income securities $ (302) $ (626) $ (886)
Equity securities (131) (57) (237)
Mortgage loans (37) (65) (97)
Limited partnership interests (6) (46) (308)
Other investments (20) (3) (34)
Impairment write-downs $ (496) $ (797) $ (1,562)
Impairment write-downs in 2011 were primarily driven by RMBS, which experienced deterioration in expected cash
flows; investments with commercial real estate exposure, including CMBS, mortgage loans and municipal bonds, which
were impacted by lower real estate valuations or experienced deterioration in expected cash flows; and corporate fixed
income securities impacted by issuer specific circumstances. Impairment write-downs on below investment grade
RMBS and CMBS in 2011 were $169 million and $55 million, respectively. Equity securities were also written down due
to the length of time and extent to which fair value was below cost, considering our assessment of the financial
condition and near-term and long-term prospects of the issuer, including relevant industry conditions and trends.
79