Allstate 2012 Annual Report Download - page 224
Download and view the complete annual report
Please find page 224 of the 2012 Allstate annual report below. You can navigate through the pages in the report by either clicking on the pages listed below, or by using the keyword search tool below to find specific information within the annual report.-
 1
1 -
2
-
3
-
4
-
5
-
6
-
7
-
8
-
9
-
10
-
11
-
12
-
13
-
14
-
15
-
16
-
17
-
18
-
19
-
20
-
21
-
22
-
23
-
24
-
25
-
26
-
27
-
28
-
29
-
30
-
31
-
32
-
33
-
34
-
35
-
36
-
37
-
38
-
39
-
40
-
41
-
42
-
43
-
44
-
45
-
46
-
47
-
48
-
49
-
50
-
51
-
52
-
53
-
54
-
55
-
56
-
57
-
58
-
59
-
60
-
61
-
62
-
63
-
64
-
65
-
66
-
67
-
68
-
69
-
70
-
71
-
72
-
73
-
74
-
75
-
76
-
77
-
78
-
79
-
80
-
81
-
82
-
83
-
84
-
85
-
86
-
87
-
88
-
89
-
90
-
91
-
92
-
93
-
94
-
95
-
96
-
97
-
98
-
99
-
100
-
101
-
102
-
103
-
104
-
105
-
106
-
107
-
108
-
109
-
110
-
111
-
112
-
113
-
114
-
115
-
116
-
117
-
118
-
119
-
120
-
121
-
122
-
123
-
124
-
125
-
126
-
127
-
128
-
129
-
130
-
131
-
132
-
133
-
134
-
135
-
136
-
137
-
138
-
139
-
140
-
141
-
142
-
143
-
144
-
145
-
146
-
147
-
148
-
149
-
150
-
151
-
152
-
153
-
154
-
155
-
156
-
157
-
158
-
159
-
160
-
161
-
162
-
163
-
164
-
165
-
166
-
167
-
168
-
169
-
170
-
171
-
172
-
173
-
174
-
175
-
176
-
177
-
178
-
179
-
180
-
181
-
182
-
183
-
184
-
185
-
186
-
187
-
188
-
189
-
190
-
191
-
192
-
193
-
194
-
195
-
196
-
197
-
198
-
199
-
200
-
201
-
202
-
203
-
204
-
205
-
206
-
207
-
208
-
209
-
210
-
211
-
212
-
213
-
 214
214 -
 215
215 -
 216
216 -
 217
217 -
 218
218 -
 219
219 -
 220
220 -
 221
221 -
 222
222 -
 223
223 -
 224
224 -
 225
225 -
 226
226 -
 227
227 -
 228
228 -
 229
229 -
 230
230 -
 231
231 -
 232
232 -
 233
233 -
 234
234 -
235
-
236
-
237
-
238
-
239
-
240
-
241
-
242
-
243
-
244
-
245
-
246
-
247
-
248
-
249
-
250
-
251
-
252
-
253
-
254
-
255
-
256
-
257
-
258
-
259
-
260
-
261
-
262
-
263
-
264
-
265
-
266
-
267
-
268
 |
 |

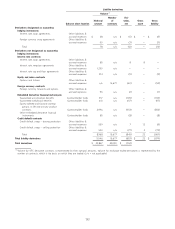
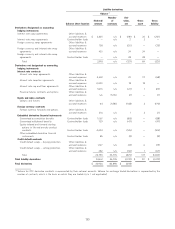
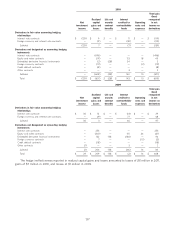
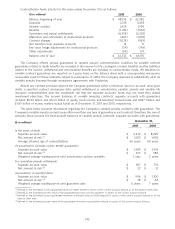
The following tables provide a summary of the changes in fair value of the Company’s fair value hedging
relationships in the Consolidated Statements of Operations for the years ended December 31.
2011
($ in millions)
Gain (loss) on
derivatives Gain (loss) on hedged risk
Foreign
Interest currency &
Location of gain or (loss) recognized rate interest rate Contractholder
in net income on derivatives contracts contracts funds Investments
Interest credited to contractholder funds $ (7) $ (34) $ 41 $ —
Net investment income 26 — — (26)
Realized capital gains and losses (8) — — —
Total $ 11 $ (34) $ 41 $ (26)
2010
Gain (loss) on
derivatives Gain (loss) on hedged risk
Foreign
Interest currency &
Location of gain or (loss) recognized rate interest rate Contractholder
in net income on derivatives contracts contracts funds Investments
Interest credited to contractholder funds $ — $ (48) $ 48 $ —
Net investment income (33) — — 33
Realized capital gains and losses 9 (2) — —
Total $ (24) $ (50) $ 48 $ 33
2009
Gain (loss) on
derivatives Gain (loss) on hedged risk
Foreign
Interest currency &
Location of gain or (loss) recognized rate interest rate Contractholder
in net income on derivatives contracts contracts funds Investments
Interest credited to contractholder funds $ (26) $ 39 $ (13) $ —
Net investment income 164 — — (164)
Realized capital gains and losses 12 (9) — —
Total $ 150 $ 30 $ (13) $ (164)
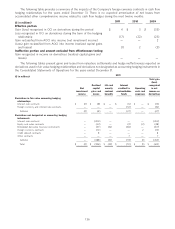
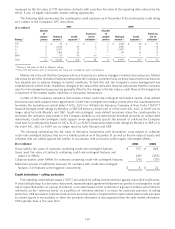
The Company manages its exposure to credit risk by utilizing highly rated counterparties, establishing risk control
limits, executing legally enforceable master netting agreements (‘‘MNAs’’) and obtaining collateral where appropriate.
The Company uses MNAs for OTC derivative transactions that permit either party to net payments due for transactions
and collateral is either pledged or obtained when certain predetermined exposure limits are exceeded. As of
December 31, 2011, counterparties pledged $64 million in cash and securities to the Company, and the Company
pledged $82 million in cash and securities to counterparties which includes $76 million of collateral posted under
MNAs for contracts containing credit-risk-contingent provisions that are in a liability position and $6 million of collateral
posted under MNAs for contracts without credit-risk-contingent liabilities. The Company has not incurred any losses on
derivative financial instruments due to counterparty nonperformance. Other derivatives, including futures and certain
option contracts, are traded on organized exchanges which require margin deposits and guarantee the execution of
trades, thereby mitigating any potential credit risk.
Counterparty credit exposure represents the Company’s potential loss if all of the counterparties concurrently fail to
perform under the contractual terms of the contracts and all collateral, if any, becomes worthless. This exposure is
138