Allstate 2012 Annual Report Download - page 219
Download and view the complete annual report
Please find page 219 of the 2012 Allstate annual report below. You can navigate through the pages in the report by either clicking on the pages listed below, or by using the keyword search tool below to find specific information within the annual report.-
 1
1 -
2
-
3
-
4
-
5
-
6
-
7
-
8
-
9
-
10
-
11
-
12
-
13
-
14
-
15
-
16
-
17
-
18
-
19
-
20
-
21
-
22
-
23
-
24
-
25
-
26
-
27
-
28
-
29
-
30
-
31
-
32
-
33
-
34
-
35
-
36
-
37
-
38
-
39
-
40
-
41
-
42
-
43
-
44
-
45
-
46
-
47
-
48
-
49
-
50
-
51
-
52
-
53
-
54
-
55
-
56
-
57
-
58
-
59
-
60
-
61
-
62
-
63
-
64
-
65
-
66
-
67
-
68
-
69
-
70
-
71
-
72
-
73
-
74
-
75
-
76
-
77
-
78
-
79
-
80
-
81
-
82
-
83
-
84
-
85
-
86
-
87
-
88
-
89
-
90
-
91
-
92
-
93
-
94
-
95
-
96
-
97
-
98
-
99
-
100
-
101
-
102
-
103
-
104
-
105
-
106
-
107
-
108
-
109
-
110
-
111
-
112
-
113
-
114
-
115
-
116
-
117
-
118
-
119
-
120
-
121
-
122
-
123
-
124
-
125
-
126
-
127
-
128
-
129
-
130
-
131
-
132
-
133
-
134
-
135
-
136
-
137
-
138
-
139
-
140
-
141
-
142
-
143
-
144
-
145
-
146
-
147
-
148
-
149
-
150
-
151
-
152
-
153
-
154
-
155
-
156
-
157
-
158
-
159
-
160
-
161
-
162
-
163
-
164
-
165
-
166
-
167
-
168
-
169
-
170
-
171
-
172
-
173
-
174
-
175
-
176
-
177
-
178
-
179
-
180
-
181
-
182
-
183
-
184
-
185
-
186
-
187
-
188
-
189
-
190
-
191
-
192
-
193
-
194
-
195
-
196
-
197
-
198
-
199
-
200
-
201
-
202
-
203
-
204
-
205
-
206
-
207
-
208
-
 209
209 -
 210
210 -
 211
211 -
 212
212 -
 213
213 -
 214
214 -
 215
215 -
 216
216 -
 217
217 -
 218
218 -
 219
219 -
 220
220 -
 221
221 -
 222
222 -
 223
223 -
 224
224 -
 225
225 -
 226
226 -
 227
227 -
 228
228 -
 229
229 -
230
-
231
-
232
-
233
-
234
-
235
-
236
-
237
-
238
-
239
-
240
-
241
-
242
-
243
-
244
-
245
-
246
-
247
-
248
-
249
-
250
-
251
-
252
-
253
-
254
-
255
-
256
-
257
-
258
-
259
-
260
-
261
-
262
-
263
-
264
-
265
-
266
-
267
-
268
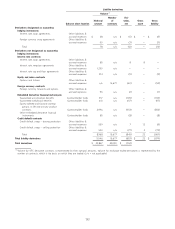
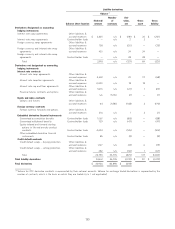
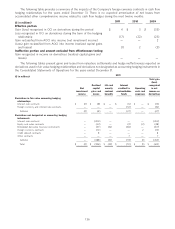
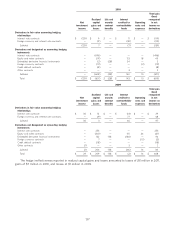
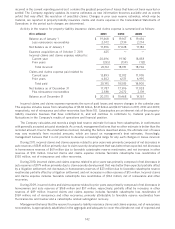
 |
 |

Liability derivatives
Volume (1)
Number Fair
Notional of value, Gross Gross
Balance sheet location amount contracts net asset liability
Derivatives designated as accounting
hedging instruments
Interest rate swap agreements Other liabilities &
accrued expenses $ 28 n/a $ (5) $ — $ (5)
Foreign currency swap agreements Other liabilities &
accrued expenses 50 n/a (7) — (7)
Total 78 n/a (12) — (12)
Derivatives not designated as accounting
hedging instruments
Interest rate contracts
Interest rate swap agreements Other liabilities &
accrued expenses 85 n/a 8 8 —
Interest rate swaption agreements Other liabilities &
accrued expenses 1,250 n/a — — —
Interest rate cap and floor agreements Other liabilities &
accrued expenses 914 n/a (9) — (9)
Equity and index contracts
Options and futures Other liabilities &
accrued expenses n/a 15,677 (50) — (50)
Foreign currency contracts
Foreign currency forwards and options Other liabilities &
accrued expenses 96 n/a (1) — (1)
Embedded derivative financial instruments
Guaranteed accumulation benefits Contractholder funds 917 n/a (105) — (105)
Guaranteed withdrawal benefits Contractholder funds 613 n/a (57) — (57)
Equity-indexed and forward starting
options in life and annuity product
contracts Contractholder funds 3,996 n/a (553) — (553)
Other embedded derivative financial
instruments Contractholder funds 85 n/a (8) — (8)
Credit default contracts
Credit default swaps – buying protection Other liabilities &
accrued expenses 509 n/a 7 12 (5)
Credit default swaps – selling protection Other liabilities &
accrued expenses 503 n/a (77) 2 (79)
Total 8,968 15,677 (845) 22 (867)
Total liability derivatives 9,046 15,677 (857) $ 22 $ (879)
Total derivatives $ 22,857 33,029 $ (752)
(1) Volume for OTC derivative contracts is represented by their notional amounts. Volume for exchange traded derivatives is represented by the
number of contracts, which is the basis on which they are traded. (n/a = not applicable)
133