Allstate 2012 Annual Report Download - page 171
Download and view the complete annual report
Please find page 171 of the 2012 Allstate annual report below. You can navigate through the pages in the report by either clicking on the pages listed below, or by using the keyword search tool below to find specific information within the annual report.-
 1
1 -
2
-
3
-
4
-
5
-
6
-
7
-
8
-
9
-
10
-
11
-
12
-
13
-
14
-
15
-
16
-
17
-
18
-
19
-
20
-
21
-
22
-
23
-
24
-
25
-
26
-
27
-
28
-
29
-
30
-
31
-
32
-
33
-
34
-
35
-
36
-
37
-
38
-
39
-
40
-
41
-
42
-
43
-
44
-
45
-
46
-
47
-
48
-
49
-
50
-
51
-
52
-
53
-
54
-
55
-
56
-
57
-
58
-
59
-
60
-
61
-
62
-
63
-
64
-
65
-
66
-
67
-
68
-
69
-
70
-
71
-
72
-
73
-
74
-
75
-
76
-
77
-
78
-
79
-
80
-
81
-
82
-
83
-
84
-
85
-
86
-
87
-
88
-
89
-
90
-
91
-
92
-
93
-
94
-
95
-
96
-
97
-
98
-
99
-
100
-
101
-
102
-
103
-
104
-
105
-
106
-
107
-
108
-
109
-
110
-
111
-
112
-
113
-
114
-
115
-
116
-
117
-
118
-
119
-
120
-
121
-
122
-
123
-
124
-
125
-
126
-
127
-
128
-
129
-
130
-
131
-
132
-
133
-
134
-
135
-
136
-
137
-
138
-
139
-
140
-
141
-
142
-
143
-
144
-
145
-
146
-
147
-
148
-
149
-
150
-
151
-
152
-
153
-
154
-
155
-
156
-
157
-
158
-
159
-
160
-
 161
161 -
 162
162 -
 163
163 -
 164
164 -
 165
165 -
 166
166 -
 167
167 -
 168
168 -
 169
169 -
 170
170 -
 171
171 -
 172
172 -
 173
173 -
 174
174 -
 175
175 -
 176
176 -
 177
177 -
 178
178 -
 179
179 -
 180
180 -
 181
181 -
182
-
183
-
184
-
185
-
186
-
187
-
188
-
189
-
190
-
191
-
192
-
193
-
194
-
195
-
196
-
197
-
198
-
199
-
200
-
201
-
202
-
203
-
204
-
205
-
206
-
207
-
208
-
209
-
210
-
211
-
212
-
213
-
214
-
215
-
216
-
217
-
218
-
219
-
220
-
221
-
222
-
223
-
224
-
225
-
226
-
227
-
228
-
229
-
230
-
231
-
232
-
233
-
234
-
235
-
236
-
237
-
238
-
239
-
240
-
241
-
242
-
243
-
244
-
245
-
246
-
247
-
248
-
249
-
250
-
251
-
252
-
253
-
254
-
255
-
256
-
257
-
258
-
259
-
260
-
261
-
262
-
263
-
264
-
265
-
266
-
267
-
268
 |
 |
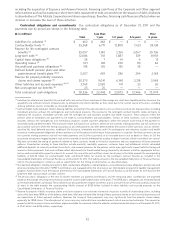
Holding other assumptions constant, a hypothetical decrease of 100 basis points in the weighted average discount
rate would result in an increase of $52 million in net periodic pension cost and a $427 million increase in the
unrecognized pension and other postretirement benefit cost liability of our pension plans recorded as accumulated
other comprehensive income as of December 31, 2011, compared to an increase of $43 million in net periodic pension
cost and a $392 million increase in the unrecognized pension and other postretirement benefit cost liability as of
December 31, 2010. A hypothetical increase of 100 basis points in the weighted average discount rate would decrease
net periodic pension cost by $46 million and would decrease the unrecognized pension and other postretirement benefit
cost liability of our pension plans recorded as accumulated other comprehensive income by $360 million as of
December 31, 2011, compared to a decrease in net periodic pension cost of $38 million and a $331 million decrease in
the unrecognized pension and other postretirement benefit cost liability of our pension plans recorded as accumulated
other comprehensive income as of December 31, 2010. This non-symmetrical range results from the non-linear
relationship between discount rates and pension obligations, and changes in the amortization of unrealized net actuarial
gains and losses.
The expected long-term rate of return on plan assets reflects the average rate of earnings expected on plan assets.
While this rate reflects long-term assumptions and is consistent with long-term historical returns, sustained changes in
the market or changes in the mix of plan assets may lead to revisions in the assumed long-term rate of return on plan
assets that may result in variability of pension cost. Differences between the actual return on plan assets and the
expected long-term rate of return on plan assets are a component of unrecognized gains or losses, which may be
amortized as a component of net actuarial gains and losses and recorded in accumulated other comprehensive income.
As a result, the effect of changes in fair value on our pension cost may be experienced in results of operations in periods
subsequent to those in which the fluctuations actually occur.
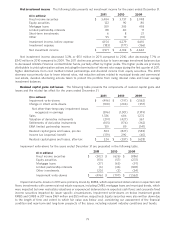
Holding other assumptions constant, a hypothetical decrease of 100 basis points in the expected long-term rate of
return on plan assets would result in an increase of $47 million in pension cost as of December 31, 2011, compared to
$44 million as of December 31, 2010. A hypothetical increase of 100 basis points in the expected long-term rate of
return on plan assets would result in a decrease in net periodic pension cost of $47 million as of December 31, 2011,
compared to $44 million as of December 31, 2010.
We target funding levels that do not restrict the payment of plan benefits in our domestic plans and were within our
targeted range as of December 31, 2011. In 2011, we contributed $264 million to our pension plans. We expect to
contribute $417 million for the 2012 fiscal year to maintain the plans’ funded status. This estimate could change
significantly following either a dramatic improvement or decline in investment markets.
Other post employment benefits
In 2010, the Patient Protection and Affordable Care Act was signed into law. One aspect of this legislation is the
introduction of an excise tax, effective in 2018, on ‘‘high cost’’ plans. The liabilities as of December 31, 2011 for the
postretirement medical plans include an estimate of this additional liability, which amounts to $3 million.
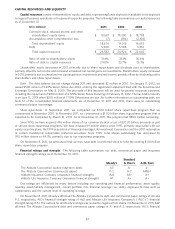
GOODWILL
Goodwill represents the excess of amounts paid for acquiring businesses over the fair value of the net assets
acquired. The goodwill balances were $824 million and $418 million as of December 31, 2011 and $456 million and
$418 million as of December 31, 2010 for the Allstate Protection segment and the Allstate Financial segment,
respectively. The increase in 2011 relates to the acquisition of Esurance and Answer Financial. Our reporting units are
equivalent to our reporting segments, Allstate Protection and Allstate Financial. Goodwill is allocated to reporting units
based on which unit is expected to benefit from the synergies of the business combination.
Goodwill is not amortized but is tested for impairment at least annually. We perform our annual goodwill
impairment testing during the fourth quarter of each year based upon data as of the close of the third quarter. We also
review goodwill for impairment whenever events or changes in circumstances, such as deteriorating or adverse market
conditions, indicate that it is more likely than not that the carrying amount of goodwill may exceed its implied fair value.
Impairment testing requires the use of estimates and judgments. For purposes of goodwill impairment testing, if the
carrying value of a reporting unit exceeds its estimated fair value, the second step of the goodwill test is required. In such
instances, the implied fair value of the goodwill is determined in the same manner as the amount of goodwill that would
be determined in a business acquisition. The excess of the carrying value of goodwill over the implied fair value of
goodwill would be recognized as an impairment and recorded as a charge against net income.
To estimate the fair value of our reporting units for our annual impairment test as of September 30, 2011, we utilized
a combination of widely accepted valuation techniques including a stock price and market capitalization analysis,
85