Allstate 2012 Annual Report Download - page 181
Download and view the complete annual report
Please find page 181 of the 2012 Allstate annual report below. You can navigate through the pages in the report by either clicking on the pages listed below, or by using the keyword search tool below to find specific information within the annual report.-
 1
1 -
2
-
3
-
4
-
5
-
6
-
7
-
8
-
9
-
10
-
11
-
12
-
13
-
14
-
15
-
16
-
17
-
18
-
19
-
20
-
21
-
22
-
23
-
24
-
25
-
26
-
27
-
28
-
29
-
30
-
31
-
32
-
33
-
34
-
35
-
36
-
37
-
38
-
39
-
40
-
41
-
42
-
43
-
44
-
45
-
46
-
47
-
48
-
49
-
50
-
51
-
52
-
53
-
54
-
55
-
56
-
57
-
58
-
59
-
60
-
61
-
62
-
63
-
64
-
65
-
66
-
67
-
68
-
69
-
70
-
71
-
72
-
73
-
74
-
75
-
76
-
77
-
78
-
79
-
80
-
81
-
82
-
83
-
84
-
85
-
86
-
87
-
88
-
89
-
90
-
91
-
92
-
93
-
94
-
95
-
96
-
97
-
98
-
99
-
100
-
101
-
102
-
103
-
104
-
105
-
106
-
107
-
108
-
109
-
110
-
111
-
112
-
113
-
114
-
115
-
116
-
117
-
118
-
119
-
120
-
121
-
122
-
123
-
124
-
125
-
126
-
127
-
128
-
129
-
130
-
131
-
132
-
133
-
134
-
135
-
136
-
137
-
138
-
139
-
140
-
141
-
142
-
143
-
144
-
145
-
146
-
147
-
148
-
149
-
150
-
151
-
152
-
153
-
154
-
155
-
156
-
157
-
158
-
159
-
160
-
161
-
162
-
163
-
164
-
165
-
166
-
167
-
168
-
169
-
170
-
 171
171 -
 172
172 -
 173
173 -
 174
174 -
 175
175 -
 176
176 -
 177
177 -
 178
178 -
 179
179 -
 180
180 -
 181
181 -
 182
182 -
 183
183 -
 184
184 -
 185
185 -
 186
186 -
 187
187 -
 188
188 -
 189
189 -
 190
190 -
 191
191 -
192
-
193
-
194
-
195
-
196
-
197
-
198
-
199
-
200
-
201
-
202
-
203
-
204
-
205
-
206
-
207
-
208
-
209
-
210
-
211
-
212
-
213
-
214
-
215
-
216
-
217
-
218
-
219
-
220
-
221
-
222
-
223
-
224
-
225
-
226
-
227
-
228
-
229
-
230
-
231
-
232
-
233
-
234
-
235
-
236
-
237
-
238
-
239
-
240
-
241
-
242
-
243
-
244
-
245
-
246
-
247
-
248
-
249
-
250
-
251
-
252
-
253
-
254
-
255
-
256
-
257
-
258
-
259
-
260
-
261
-
262
-
263
-
264
-
265
-
266
-
267
-
268
 |
 |

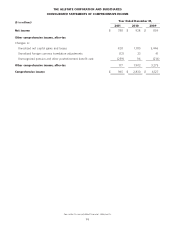
THE ALLSTATE CORPORATION AND SUBSIDIARIES
CONSOLIDATED STATEMENTS OF OPERATIONS
Year Ended December 31,
($ in millions, except per share data)
2011 2010 2009
Revenues
Property-liability insurance premiums (net of reinsurance ceded of
$1,098, $1,092 and $1,056) $ 25,942 $ 25,957 $ 26,194
Life and annuity premiums and contract charges (net of reinsurance
ceded of $750, $804 and $838) 2,238 2,168 1,958
Net investment income 3,971 4,102 4,444
Realized capital gains and losses:
Total other-than-temporary impairment losses (563) (937) (2,376)
Portion of loss recognized in other comprehensive income (33) (64) 457
Net other-than-temporary impairment loss recognized in earnings (596) (1,001) (1,919)
Sales and other realized capital gains and losses 1,099 174 1,336
Total realized capital gains and losses 503 (827) (583)
32,654 31,400 32,013
Costs and expenses
Property-liability insurance claims and claims expense (net of
reinsurance ceded of $927, $271 and $415) 20,161 18,951 18,746
Life and annuity contract benefits (net of reinsurance ceded of $653,
$702 and $642) 1,761 1,815 1,617
Interest credited to contractholder funds (net of reinsurance ceded of
$27, $32 and $32) 1,645 1,807 2,126
Amortization of deferred policy acquisition costs 4,233 4,034 4,754
Operating costs and expenses 3,468 3,281 3,007
Restructuring and related charges 44 30 130
Interest expense 367 367 392
31,679 30,285 30,772
(Loss) gain on disposition of operations (15) 11 7
Income from operations before income tax expense 960 1,126 1,248
Income tax expense 172 198 394
Net income $ 788 $ 928 $ 854
Earnings per share:
Net income per share – Basic $ 1.51 $ 1.72 $ 1.58
Weighted average shares – Basic 520.7 540.3 539.6
Net income per share – Diluted $ 1.51 $ 1.71 $ 1.58
Weighted average shares – Diluted 523.1 542.5 540.9
Cash dividends declared per share $ 0.84 $ 0.80 $ 0.80
See notes to consolidated financial statements.
95