Allstate 2012 Annual Report Download - page 141
Download and view the complete annual report
Please find page 141 of the 2012 Allstate annual report below. You can navigate through the pages in the report by either clicking on the pages listed below, or by using the keyword search tool below to find specific information within the annual report.-
 1
1 -
2
-
3
-
4
-
5
-
6
-
7
-
8
-
9
-
10
-
11
-
12
-
13
-
14
-
15
-
16
-
17
-
18
-
19
-
20
-
21
-
22
-
23
-
24
-
25
-
26
-
27
-
28
-
29
-
30
-
31
-
32
-
33
-
34
-
35
-
36
-
37
-
38
-
39
-
40
-
41
-
42
-
43
-
44
-
45
-
46
-
47
-
48
-
49
-
50
-
51
-
52
-
53
-
54
-
55
-
56
-
57
-
58
-
59
-
60
-
61
-
62
-
63
-
64
-
65
-
66
-
67
-
68
-
69
-
70
-
71
-
72
-
73
-
74
-
75
-
76
-
77
-
78
-
79
-
80
-
81
-
82
-
83
-
84
-
85
-
86
-
87
-
88
-
89
-
90
-
91
-
92
-
93
-
94
-
95
-
96
-
97
-
98
-
99
-
100
-
101
-
102
-
103
-
104
-
105
-
106
-
107
-
108
-
109
-
110
-
111
-
112
-
113
-
114
-
115
-
116
-
117
-
118
-
119
-
120
-
121
-
122
-
123
-
124
-
125
-
126
-
127
-
128
-
129
-
130
-
 131
131 -
 132
132 -
 133
133 -
 134
134 -
 135
135 -
 136
136 -
 137
137 -
 138
138 -
 139
139 -
 140
140 -
 141
141 -
 142
142 -
 143
143 -
 144
144 -
 145
145 -
 146
146 -
 147
147 -
 148
148 -
 149
149 -
 150
150 -
 151
151 -
152
-
153
-
154
-
155
-
156
-
157
-
158
-
159
-
160
-
161
-
162
-
163
-
164
-
165
-
166
-
167
-
168
-
169
-
170
-
171
-
172
-
173
-
174
-
175
-
176
-
177
-
178
-
179
-
180
-
181
-
182
-
183
-
184
-
185
-
186
-
187
-
188
-
189
-
190
-
191
-
192
-
193
-
194
-
195
-
196
-
197
-
198
-
199
-
200
-
201
-
202
-
203
-
204
-
205
-
206
-
207
-
208
-
209
-
210
-
211
-
212
-
213
-
214
-
215
-
216
-
217
-
218
-
219
-
220
-
221
-
222
-
223
-
224
-
225
-
226
-
227
-
228
-
229
-
230
-
231
-
232
-
233
-
234
-
235
-
236
-
237
-
238
-
239
-
240
-
241
-
242
-
243
-
244
-
245
-
246
-
247
-
248
-
249
-
250
-
251
-
252
-
253
-
254
-
255
-
256
-
257
-
258
-
259
-
260
-
261
-
262
-
263
-
264
-
265
-
266
-
267
-
268
 |
 |

Our institutional product line consists of funding agreements sold to unaffiliated trusts that use them to back
medium-term notes issued to institutional and individual investors. Banking products and services were previously
offered to customers through the Allstate Bank. In 2011, after receiving regulatory approval to voluntarily dissolve,
Allstate Bank ceased operations. In the first half of 2012, we expect to cancel the bank’s charter and deregister The
Allstate Corporation as a savings and loan holding company.
Allstate Financial outlook
• We plan to continue to increase premiums and contract charges on underwritten insurance products and develop
products our customers need for retirement income.
• Our growth initiatives will be primarily focused on increasing the number of customers served through our
proprietary and Allstate Benefits (workplace distribution) channels.
• We will continue to focus on improving returns and reducing our concentration in spread based products resulting
in net reductions in contractholder funds obligations.
• We expect increases in Allstate Financial’s attributed GAAP equity as there may be limitations on the amount of
dividends Allstate Financial companies can pay without prior approval by their insurance departments.
• We expect lower investment spread due to reduced contractholder funds, the continuing low interest rate
environment and changes in asset allocations. The amount by which the low interest rate environment will reduce
our investment spread is contingent on our ability to maintain the portfolio yield and lower interest crediting rates
on spread based products, which could be limited by market conditions, regulatory minimum rates or contractual
minimum rate guarantees, and may not match the timing or magnitude of changes in asset yields. We also
anticipate changing our asset allocation for long-term immediate annuities by reducing fixed income securities and
increasing investments in limited partnerships, equities and other alternative investments. This shift could result in
lower and more volatile investment income; however, we anticipate that this strategy will lead to higher total returns
and attributed equity.
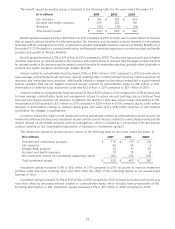
Summary analysis Summarized financial data for the years ended December 31 is presented in the following
table.
($ in millions) 2011 2010 2009
Revenues
Life and annuity premiums and contract charges $ 2,238 $ 2,168 $ 1,958
Net investment income 2,716 2,853 3,064
Realized capital gains and losses 388 (517) (431)
Total revenues 5,342 4,504 4,591
Costs and expenses
Life and annuity contract benefits (1,761) (1,815) (1,617)
Interest credited to contractholder funds (1,645) (1,807) (2,126)
Amortization of DAC (593) (356) (965)
Operating costs and expenses (455) (469) (430)
Restructuring and related charges (1) 3 (25)
Total costs and expenses (4,455) (4,444) (5,163)
(Loss) gain on disposition of operations (15) 6 7
Income tax (expense) benefit (286) (8) 82
Net income (loss) $ 586 $ 58 $ (483)
Investments as of December 31 $ 57,373 $ 61,582 $ 62,216
Net income
Life insurance $ 289
Accident and health insurance 104
Annuities and institutional and bank products 193
Net income $ 586
Net income in 2011 was $586 million compared to $58 million in 2010. The $528 million increase was primarily due
to net realized capital gains in the current year compared to net realized capital losses in the prior year, decreased
55