Allstate 2012 Annual Report Download - page 120
Download and view the complete annual report
Please find page 120 of the 2012 Allstate annual report below. You can navigate through the pages in the report by either clicking on the pages listed below, or by using the keyword search tool below to find specific information within the annual report.-
 1
1 -
2
-
3
-
4
-
5
-
6
-
7
-
8
-
9
-
10
-
11
-
12
-
13
-
14
-
15
-
16
-
17
-
18
-
19
-
20
-
21
-
22
-
23
-
24
-
25
-
26
-
27
-
28
-
29
-
30
-
31
-
32
-
33
-
34
-
35
-
36
-
37
-
38
-
39
-
40
-
41
-
42
-
43
-
44
-
45
-
46
-
47
-
48
-
49
-
50
-
51
-
52
-
53
-
54
-
55
-
56
-
57
-
58
-
59
-
60
-
61
-
62
-
63
-
64
-
65
-
66
-
67
-
68
-
69
-
70
-
71
-
72
-
73
-
74
-
75
-
76
-
77
-
78
-
79
-
80
-
81
-
82
-
83
-
84
-
85
-
86
-
87
-
88
-
89
-
90
-
91
-
92
-
93
-
94
-
95
-
96
-
97
-
98
-
99
-
100
-
101
-
102
-
103
-
104
-
105
-
106
-
107
-
108
-
109
-
 110
110 -
 111
111 -
 112
112 -
 113
113 -
 114
114 -
 115
115 -
 116
116 -
 117
117 -
 118
118 -
 119
119 -
 120
120 -
 121
121 -
 122
122 -
 123
123 -
 124
124 -
 125
125 -
 126
126 -
 127
127 -
 128
128 -
 129
129 -
 130
130 -
131
-
132
-
133
-
134
-
135
-
136
-
137
-
138
-
139
-
140
-
141
-
142
-
143
-
144
-
145
-
146
-
147
-
148
-
149
-
150
-
151
-
152
-
153
-
154
-
155
-
156
-
157
-
158
-
159
-
160
-
161
-
162
-
163
-
164
-
165
-
166
-
167
-
168
-
169
-
170
-
171
-
172
-
173
-
174
-
175
-
176
-
177
-
178
-
179
-
180
-
181
-
182
-
183
-
184
-
185
-
186
-
187
-
188
-
189
-
190
-
191
-
192
-
193
-
194
-
195
-
196
-
197
-
198
-
199
-
200
-
201
-
202
-
203
-
204
-
205
-
206
-
207
-
208
-
209
-
210
-
211
-
212
-
213
-
214
-
215
-
216
-
217
-
218
-
219
-
220
-
221
-
222
-
223
-
224
-
225
-
226
-
227
-
228
-
229
-
230
-
231
-
232
-
233
-
234
-
235
-
236
-
237
-
238
-
239
-
240
-
241
-
242
-
243
-
244
-
245
-
246
-
247
-
248
-
249
-
250
-
251
-
252
-
253
-
254
-
255
-
256
-
257
-
258
-
259
-
260
-
261
-
262
-
263
-
264
-
265
-
266
-
267
-
268
 |
 |

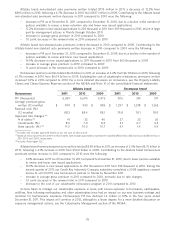
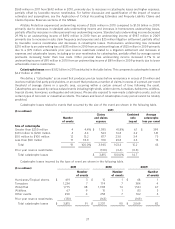
Allstate brand standard auto premiums written totaled $15.70 billion in 2011, a decrease of 0.9% from $15.84 billion
in 2010, following a 0.5% increase in 2010 from $15.76 billion in 2009. Contributing to the Allstate brand standard auto
premiums written decrease in 2011 compared to 2010 were the following:
– decrease in PIF of 1.5% as of December 31, 2011 compared to December 31, 2010, due to fewer new issued
applications and fewer policies available to renew. Excluding Florida and New York, PIF as of December 31, 2011
were comparable to December 31, 2010.
– 5.8% decrease in new issued applications on a countrywide basis to 1,908 thousand in 2011 from
2,025 thousand in 2010. Excluding Florida and New York (impacted by actions to improve profitability), new
issued applications on a countrywide basis decreased 0.1% to 1,697 thousand in 2011 from 1,699 thousand in
2010. New issued applications increased in 17 states in 2011 compared to 2010.
– increase in average gross premium in 2011 compared to 2010.
– 0.3 point increase in the renewal ratio in 2011 compared to 2010. In 2011, 39 states are showing favorable
comparisons to prior year.
Allstate brand standard auto premiums written increased in 2010 compared to 2009. Contributing to the Allstate
brand standard auto premiums written increase in 2010 compared to 2009 were the following:
– decrease in PIF as of December 31, 2010 compared to December 31, 2009, due to fewer policies available to
renew and a 0.7% decrease in net items added to existing policies to 1,498 thousand from 1,509 thousand,
reflecting industry economic trends for declines in the number of cars per household
– 0.2% decrease in new issued applications on a countrywide basis to 2,025 thousand in 2010 from
2,029 thousand in 2009 impacted by decreases in Florida and California, due in part to rate actions that were
approved in 2009 in these markets and other actions to improve profitability. Excluding Florida and California,
new issued applications on a countrywide basis increased 12.9% to 1,606 thousand in 2010 from
1,423 thousand in 2009. New issued application increased in 40 states in 2010 compared to 2009, most of
which offer an auto discount (the Preferred Package Discount) for our target customer.
– increased average gross premium in 2010 compared to 2009, primarily due to rate changes, partially offset by
customers electing to lower coverage levels of their policy
– 0.2 point decrease in the renewal ratio in 2010 compared to 2009, reflects profit management actions in
California, New York and Georgia as well as the effects of the direct channel which has a lower renewal ratio.
Excluding these items the renewal ratio had a 0.3 point increase.
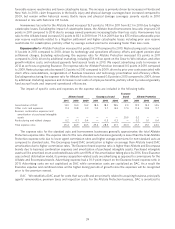
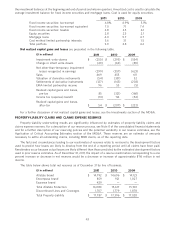
The level of Encompass premiums written continues to be impacted by comprehensive actions designed to
reposition Encompass as the package policy carrier of choice for above middle market customers through independent
agencies in order to drive stable, consistent earnings growth over time. Some of the actions contributing to the
Encompass brand standard auto premiums written decrease in 2011 compared to 2010 were the following:
– Aligned pricing and underwriting with strategic direction
– Terminated relationships with certain independent agencies
– Non-renewal of underperforming business
– Discontinued writing the Special Value product (middle market auto product focused on segment auto) and
Deerbrook (non-standard auto) in certain states
– Non-renewal of property in Florida
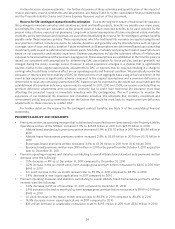
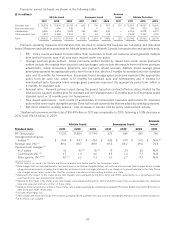
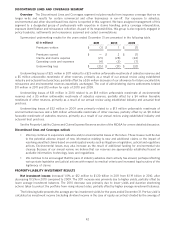
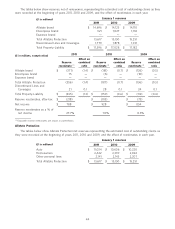
Non-standard auto premiums written totaled $776 million in 2011, a decrease of 12.7% from $889 million in 2010,
following a 6.3% decrease in 2009 from $949 million in 2009.
Allstate brand
Non-Standard Auto 2011 2010 2009
PIF (thousands) 571 640 719
Average premium-gross written
(6 months) $ 606 $ 624 $ 616
Renewal ratio (%) (6 months) 70.4 71.4 72.5
Approved rate changes:
# of states 13 (2) 11 (2) 11
Countrywide (%) 6.0 4.6 2.6
State specific (%) (1) 12.8 9.6 6.5
(1) Based on historical premiums written in those states, rate changes approved for non-standard auto
totaled $49 million, $41 million and $25 million in 2011, 2010 and 2009, respectively.
(2) Includes Washington D.C.
34