Allstate 2012 Annual Report Download - page 132
Download and view the complete annual report
Please find page 132 of the 2012 Allstate annual report below. You can navigate through the pages in the report by either clicking on the pages listed below, or by using the keyword search tool below to find specific information within the annual report.-
 1
1 -
2
-
3
-
4
-
5
-
6
-
7
-
8
-
9
-
10
-
11
-
12
-
13
-
14
-
15
-
16
-
17
-
18
-
19
-
20
-
21
-
22
-
23
-
24
-
25
-
26
-
27
-
28
-
29
-
30
-
31
-
32
-
33
-
34
-
35
-
36
-
37
-
38
-
39
-
40
-
41
-
42
-
43
-
44
-
45
-
46
-
47
-
48
-
49
-
50
-
51
-
52
-
53
-
54
-
55
-
56
-
57
-
58
-
59
-
60
-
61
-
62
-
63
-
64
-
65
-
66
-
67
-
68
-
69
-
70
-
71
-
72
-
73
-
74
-
75
-
76
-
77
-
78
-
79
-
80
-
81
-
82
-
83
-
84
-
85
-
86
-
87
-
88
-
89
-
90
-
91
-
92
-
93
-
94
-
95
-
96
-
97
-
98
-
99
-
100
-
101
-
102
-
103
-
104
-
105
-
106
-
107
-
108
-
109
-
110
-
111
-
112
-
113
-
114
-
115
-
116
-
117
-
118
-
119
-
120
-
121
-
 122
122 -
 123
123 -
 124
124 -
 125
125 -
 126
126 -
 127
127 -
 128
128 -
 129
129 -
 130
130 -
 131
131 -
 132
132 -
 133
133 -
 134
134 -
 135
135 -
 136
136 -
 137
137 -
 138
138 -
 139
139 -
 140
140 -
 141
141 -
 142
142 -
143
-
144
-
145
-
146
-
147
-
148
-
149
-
150
-
151
-
152
-
153
-
154
-
155
-
156
-
157
-
158
-
159
-
160
-
161
-
162
-
163
-
164
-
165
-
166
-
167
-
168
-
169
-
170
-
171
-
172
-
173
-
174
-
175
-
176
-
177
-
178
-
179
-
180
-
181
-
182
-
183
-
184
-
185
-
186
-
187
-
188
-
189
-
190
-
191
-
192
-
193
-
194
-
195
-
196
-
197
-
198
-
199
-
200
-
201
-
202
-
203
-
204
-
205
-
206
-
207
-
208
-
209
-
210
-
211
-
212
-
213
-
214
-
215
-
216
-
217
-
218
-
219
-
220
-
221
-
222
-
223
-
224
-
225
-
226
-
227
-
228
-
229
-
230
-
231
-
232
-
233
-
234
-
235
-
236
-
237
-
238
-
239
-
240
-
241
-
242
-
243
-
244
-
245
-
246
-
247
-
248
-
249
-
250
-
251
-
252
-
253
-
254
-
255
-
256
-
257
-
258
-
259
-
260
-
261
-
262
-
263
-
264
-
265
-
266
-
267
-
268
 |
 |

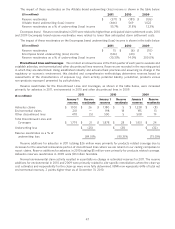
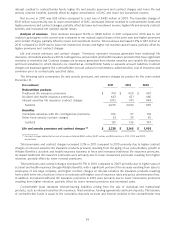
The following tables reflect the accident years to which the reestimates shown above are applicable by line of
business. Favorable reserve reestimates are shown in parentheses.
2011 Prior year reserve reestimates
2001 &($ in millions)
prior 2002 2003 2004 2005 2006 2007 2008 2009 2010 Total
Allstate brand $ 123 $ 16 $ 26 $ 8 $ 5 $ 7 $ — $ (28) $ (150) $ (378) $ (371)
Encompass brand 2 — (1) — 1 1 (1) 2 2 9 15
Total Allstate
Protection 125 16 25 8 6 8 (1) (26) (148) (369) (356)
Discontinued Lines
and Coverages 21 —————————21
Total Property-
Liability $ 146 $ 16 $ 25 $ 8 $ 6 $ 8 $ (1) $ (26) $ (148) $ (369) $ (335)
2010 Prior year reserve reestimates
2000 &($ in millions)
prior 2001 2002 2003 2004 2005 2006 2007 2008 2009 Total
Allstate brand $ 262 $ (1) $ (7) $ (18) $ (15) $ (51) $ (106) $ (86) $ (45) $ (114) $ (181)
Encompass brand 1 — 1 1 2 6 — (6) (1) (10) (6)
Total Allstate
Protection 263 (1) (6) (17) (13) (45) (106) (92) (46) (124) (187)
Discontinued Lines
and Coverages 28 —————————28
Total Property-
Liability $ 291 $ (1) $ (6) $ (17) $ (13) $ (45) $ (106) $ (92) $ (46) $ (124) $ (159)
2009 Prior year reserve reestimates
1999 &($ in millions)
prior 2000 2001 2002 2003 2004 2005 2006 2007 2008 Total
Allstate brand $ 247 $ 46 $ 58 $ 44 $ 37 $ 85 $ 74 $ (149) $ (151) $ (417) $ (126)
Encompass brand — 3 1 3 6 5 10 8 (7) (39) (10)
Total Allstate
Protection 247 49 59 47 43 90 84 (141) (158) (456) (136)
Discontinued Lines
and Coverages 24 ———————— —24
Total Property-
Liability $ 271 $ 49 $ 59 $ 47 $ 43 $ 90 $ 84 $ (141) $ (158) $ (456) $ (112)
Allstate brand prior year reserve reestimates were $371 million favorable in 2011, $181 million favorable in 2010 and
$126 million favorable in 2009. In 2011, this was primarily due to severity development that was better than expected
and favorable catastrophe reserve reestimates. The increased reserves in accident years 2001 & prior is due to a
reclassification of injury reserves to older years and reserve strengthening. In 2010, this was primarily due to favorable
catastrophe reserve reestimates and severity development that was better than expected, partially offset by litigation
settlements. The increased reserves in accident years 2000 & prior is due to the litigation settlements of $100 million, a
reclassification of injury reserves to older years and reserve strengthening. In 2009, this was primarily due to favorable
reserve reestimates from Hurricanes Ike and Gustav and a catastrophe related subrogation recovery. The shift of
reserves to older accident years is attributable to a reallocation of reserves related to employee postretirement benefits
to more accident years, and a reclassification of injury and 2008 non-injury reserves to older years.
These trends are primarily responsible for revisions to loss development factors, as previously described, used to
predict how losses are likely to develop from the end of a reporting period until all claims have been paid. Because these
trends cause actual losses to differ from those predicted by the estimated development factors used in prior reserve
estimates, reserves are revised as actuarial studies validate new trends based on the indications of updated
development factor calculations.
46