Allstate 2012 Annual Report Download - page 158
Download and view the complete annual report
Please find page 158 of the 2012 Allstate annual report below. You can navigate through the pages in the report by either clicking on the pages listed below, or by using the keyword search tool below to find specific information within the annual report.-
 1
1 -
2
-
3
-
4
-
5
-
6
-
7
-
8
-
9
-
10
-
11
-
12
-
13
-
14
-
15
-
16
-
17
-
18
-
19
-
20
-
21
-
22
-
23
-
24
-
25
-
26
-
27
-
28
-
29
-
30
-
31
-
32
-
33
-
34
-
35
-
36
-
37
-
38
-
39
-
40
-
41
-
42
-
43
-
44
-
45
-
46
-
47
-
48
-
49
-
50
-
51
-
52
-
53
-
54
-
55
-
56
-
57
-
58
-
59
-
60
-
61
-
62
-
63
-
64
-
65
-
66
-
67
-
68
-
69
-
70
-
71
-
72
-
73
-
74
-
75
-
76
-
77
-
78
-
79
-
80
-
81
-
82
-
83
-
84
-
85
-
86
-
87
-
88
-
89
-
90
-
91
-
92
-
93
-
94
-
95
-
96
-
97
-
98
-
99
-
100
-
101
-
102
-
103
-
104
-
105
-
106
-
107
-
108
-
109
-
110
-
111
-
112
-
113
-
114
-
115
-
116
-
117
-
118
-
119
-
120
-
121
-
122
-
123
-
124
-
125
-
126
-
127
-
128
-
129
-
130
-
131
-
132
-
133
-
134
-
135
-
136
-
137
-
138
-
139
-
140
-
141
-
142
-
143
-
144
-
145
-
146
-
147
-
 148
148 -
 149
149 -
 150
150 -
 151
151 -
 152
152 -
 153
153 -
 154
154 -
 155
155 -
 156
156 -
 157
157 -
 158
158 -
 159
159 -
 160
160 -
 161
161 -
 162
162 -
 163
163 -
 164
164 -
 165
165 -
 166
166 -
 167
167 -
 168
168 -
169
-
170
-
171
-
172
-
173
-
174
-
175
-
176
-
177
-
178
-
179
-
180
-
181
-
182
-
183
-
184
-
185
-
186
-
187
-
188
-
189
-
190
-
191
-
192
-
193
-
194
-
195
-
196
-
197
-
198
-
199
-
200
-
201
-
202
-
203
-
204
-
205
-
206
-
207
-
208
-
209
-
210
-
211
-
212
-
213
-
214
-
215
-
216
-
217
-
218
-
219
-
220
-
221
-
222
-
223
-
224
-
225
-
226
-
227
-
228
-
229
-
230
-
231
-
232
-
233
-
234
-
235
-
236
-
237
-
238
-
239
-
240
-
241
-
242
-
243
-
244
-
245
-
246
-
247
-
248
-
249
-
250
-
251
-
252
-
253
-
254
-
255
-
256
-
257
-
258
-
259
-
260
-
261
-
262
-
263
-
264
-
265
-
266
-
267
-
268
 |
 |

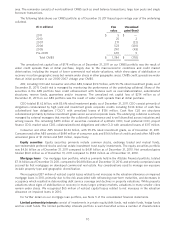
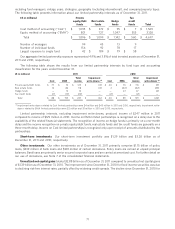
equity securities was primarily due to lower equity valuations. The following table presents unrealized net capital gains
and losses as of December 31.
($ in millions) 2011 2010
U.S. government and agencies $ 349 $ 276
Municipal 607 (267)
Corporate 2,364 1,395
Foreign government 215 337
RMBS (411) (516)
CMBS (178) (219)
ABS (214) (181)
Redeemable preferred stock 2 1
Fixed income securities (1) 2,734 826
Equity securities 160 583
EMA limited partnership interests 2 —
Derivatives (17) (22)
Unrealized net capital gains and losses, pre-tax $ 2,879 $ 1,387
(1) Unrealized net capital gains and losses for fixed income securities as of December 31, 2011 and 2010 comprise
$(267) million and $(293) million, respectively, related to unrealized net capital losses on fixed income securities with
other-than-temporary impairment and $3.00 billion and $1.12 billion, respectively, related to other unrealized net
capital gains and losses.
The unrealized net capital gains for the fixed income portfolio totaled $2.73 billion and comprised $4.40 billion of
gross unrealized gains and $1.67 billion of gross unrealized losses as of December 31, 2011. This is compared to
unrealized net capital gains for the fixed income portfolio totaling $826 million, comprised of $3.26 billion of gross
unrealized gains and $2.43 billion of gross unrealized losses as of December 31, 2010.
72