Allstate 2012 Annual Report Download - page 119
Download and view the complete annual report
Please find page 119 of the 2012 Allstate annual report below. You can navigate through the pages in the report by either clicking on the pages listed below, or by using the keyword search tool below to find specific information within the annual report.-
 1
1 -
2
-
3
-
4
-
5
-
6
-
7
-
8
-
9
-
10
-
11
-
12
-
13
-
14
-
15
-
16
-
17
-
18
-
19
-
20
-
21
-
22
-
23
-
24
-
25
-
26
-
27
-
28
-
29
-
30
-
31
-
32
-
33
-
34
-
35
-
36
-
37
-
38
-
39
-
40
-
41
-
42
-
43
-
44
-
45
-
46
-
47
-
48
-
49
-
50
-
51
-
52
-
53
-
54
-
55
-
56
-
57
-
58
-
59
-
60
-
61
-
62
-
63
-
64
-
65
-
66
-
67
-
68
-
69
-
70
-
71
-
72
-
73
-
74
-
75
-
76
-
77
-
78
-
79
-
80
-
81
-
82
-
83
-
84
-
85
-
86
-
87
-
88
-
89
-
90
-
91
-
92
-
93
-
94
-
95
-
96
-
97
-
98
-
99
-
100
-
101
-
102
-
103
-
104
-
105
-
106
-
107
-
108
-
 109
109 -
 110
110 -
 111
111 -
 112
112 -
 113
113 -
 114
114 -
 115
115 -
 116
116 -
 117
117 -
 118
118 -
 119
119 -
 120
120 -
 121
121 -
 122
122 -
 123
123 -
 124
124 -
 125
125 -
 126
126 -
 127
127 -
 128
128 -
 129
129 -
130
-
131
-
132
-
133
-
134
-
135
-
136
-
137
-
138
-
139
-
140
-
141
-
142
-
143
-
144
-
145
-
146
-
147
-
148
-
149
-
150
-
151
-
152
-
153
-
154
-
155
-
156
-
157
-
158
-
159
-
160
-
161
-
162
-
163
-
164
-
165
-
166
-
167
-
168
-
169
-
170
-
171
-
172
-
173
-
174
-
175
-
176
-
177
-
178
-
179
-
180
-
181
-
182
-
183
-
184
-
185
-
186
-
187
-
188
-
189
-
190
-
191
-
192
-
193
-
194
-
195
-
196
-
197
-
198
-
199
-
200
-
201
-
202
-
203
-
204
-
205
-
206
-
207
-
208
-
209
-
210
-
211
-
212
-
213
-
214
-
215
-
216
-
217
-
218
-
219
-
220
-
221
-
222
-
223
-
224
-
225
-
226
-
227
-
228
-
229
-
230
-
231
-
232
-
233
-
234
-
235
-
236
-
237
-
238
-
239
-
240
-
241
-
242
-
243
-
244
-
245
-
246
-
247
-
248
-
249
-
250
-
251
-
252
-
253
-
254
-
255
-
256
-
257
-
258
-
259
-
260
-
261
-
262
-
263
-
264
-
265
-
266
-
267
-
268
 |
 |

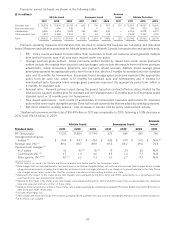
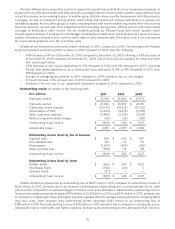
Premiums earned by brand are shown in the following table.
Esurance
($ in millions)
Allstate brand Encompass brand brand Allstate Protection
2011 2010 2009 2011 2010 2009 2011 2011 2010 2009
Standard auto $ 15,679 $ 15,814 $ 15,735 $ 620 $ 716 $ 907 $ 201 $ 16,500 $ 16,530 $ 16,642
Non-standard auto 797 896 939 2 9 27 — 799 905 966
Homeowners 5,835 5,693 5,633 365 385 444 — 6,200 6,078 6,077
Other personal lines 2,352 2,348 2,402 91 94 108 — 2,443 2,442 2,510
Total $ 24,663 $ 24,751 $ 24,709 $ 1,078 $ 1,204 $ 1,486 $ 201 $ 25,942 $ 25,955 $ 26,195
Premium operating measures and statistics that are used to analyze the business are calculated and described
below. Measures and statistics presented for Allstate brand exclude Allstate Canada, loan protection and specialty auto.
• PIF: Policy counts are based on items rather than customers. A multi-car customer would generate multiple
item (policy) counts, even if all cars were insured under one policy.
• Average premium-gross written: Gross premiums written divided by issued item count. Gross premiums
written include the impacts from discounts and surcharges, and exclude the impacts from mid-term premium
adjustments, ceded reinsurance premiums, and premium refund accruals. Allstate brand average gross
premiums represent the appropriate policy term for each line, which is 6 months for standard and non-standard
auto and 12 months for homeowners. Encompass brand average gross premiums represent the appropriate
policy term for each line, which is 12 months for standard auto and homeowners and 6 months for
non-standard auto. Esurance brand average gross premiums represent the appropriate policy term, which is
6 months for standard auto.
• Renewal ratio: Renewal policies issued during the period, based on contract effective dates, divided by the
total policies issued 6 months prior for standard and non-standard auto (12 months prior for Encompass brand
standard auto) or 12 months prior for homeowners.
• New issued applications: Item counts of automobiles or homeowners insurance applications for insurance
policies that were issued during the period. Does not include automobiles that are added by existing customers.
• Net items added to existing policies: Net increases in insured cars by policy endorsement activity.
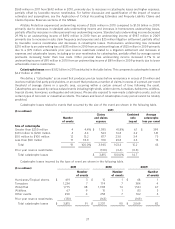
Standard auto premiums written total of $16.49 billion in 2011 was comparable to 2010, following a 0.5% decrease in
2010 from $16.56 billion in 2009.
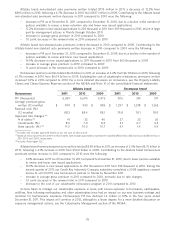
Esurance
Allstate brand Encompass brand brand
Standard Auto 2011 2010 2009 2011 2010 2009 2011
PIF (thousands) 17,213 17,484 17,744 673 689 859 786
Average premium-gross
written (1) $ 444 $ 443 $ 434 $ 935 $ 979 $ 972 $ N/A (8)
Renewal ratio (%) (1) 89.0 88.7 88.9 69.5 69.2 69.6 76.3
Approved rate changes (2):
# of states 33 45 (6) 36 (6) 19 24 36 N/A
Countrywide (%) (3) 4.7 1.4 4.6 3.5 1.4 7.3 N/A
State specific (%) (4)(5) 8.1 (7) 2.2 7.2 6.1 2.7 9.3 N/A
(1) Policy term is six months for Allstate and Esurance brands and twelve months for Encompass brand.
(2) Rate changes that are indicated based on loss trend analysis to achieve a targeted return will continue to be pursued. Rate changes do not include
rating plan enhancements, including the introduction of discounts and surcharges, that result in no change in the overall rate level in the state. These
rate changes do not reflect initial rates filed for insurance subsidiaries initially writing business in a state.
(3) Represents the impact in the states where rate changes were approved during 2011, 2010 and 2009, respectively, as a percentage of total
countrywide prior year-end premiums written.
(4) Represents the impact in the states where rate changes were approved during 2011, 2010 and 2009, respectively, as a percentage of its respective
total prior year-end premiums written in those states.
(5) Based on historical premiums written in those states, rate changes approved for standard auto totaled $731 million, $218 million and $784 million in
2011, 2010 and 2009, respectively.
(6) Includes Washington D.C.
(7) 2011 includes the impact of Florida rate increases averaging 18.5%, and New York rate increases averaging 11.2% taken across multiple companies.
(8) N/A reflects not available.
33