Allstate 2012 Annual Report Download - page 263
Download and view the complete annual report
Please find page 263 of the 2012 Allstate annual report below. You can navigate through the pages in the report by either clicking on the pages listed below, or by using the keyword search tool below to find specific information within the annual report.-
 1
1 -
2
-
3
-
4
-
5
-
6
-
7
-
8
-
9
-
10
-
11
-
12
-
13
-
14
-
15
-
16
-
17
-
18
-
19
-
20
-
21
-
22
-
23
-
24
-
25
-
26
-
27
-
28
-
29
-
30
-
31
-
32
-
33
-
34
-
35
-
36
-
37
-
38
-
39
-
40
-
41
-
42
-
43
-
44
-
45
-
46
-
47
-
48
-
49
-
50
-
51
-
52
-
53
-
54
-
55
-
56
-
57
-
58
-
59
-
60
-
61
-
62
-
63
-
64
-
65
-
66
-
67
-
68
-
69
-
70
-
71
-
72
-
73
-
74
-
75
-
76
-
77
-
78
-
79
-
80
-
81
-
82
-
83
-
84
-
85
-
86
-
87
-
88
-
89
-
90
-
91
-
92
-
93
-
94
-
95
-
96
-
97
-
98
-
99
-
100
-
101
-
102
-
103
-
104
-
105
-
106
-
107
-
108
-
109
-
110
-
111
-
112
-
113
-
114
-
115
-
116
-
117
-
118
-
119
-
120
-
121
-
122
-
123
-
124
-
125
-
126
-
127
-
128
-
129
-
130
-
131
-
132
-
133
-
134
-
135
-
136
-
137
-
138
-
139
-
140
-
141
-
142
-
143
-
144
-
145
-
146
-
147
-
148
-
149
-
150
-
151
-
152
-
153
-
154
-
155
-
156
-
157
-
158
-
159
-
160
-
161
-
162
-
163
-
164
-
165
-
166
-
167
-
168
-
169
-
170
-
171
-
172
-
173
-
174
-
175
-
176
-
177
-
178
-
179
-
180
-
181
-
182
-
183
-
184
-
185
-
186
-
187
-
188
-
189
-
190
-
191
-
192
-
193
-
194
-
195
-
196
-
197
-
198
-
199
-
200
-
201
-
202
-
203
-
204
-
205
-
206
-
207
-
208
-
209
-
210
-
211
-
212
-
213
-
214
-
215
-
216
-
217
-
218
-
219
-
220
-
221
-
222
-
223
-
224
-
225
-
226
-
227
-
228
-
229
-
230
-
231
-
232
-
233
-
234
-
235
-
236
-
237
-
238
-
239
-
240
-
241
-
242
-
243
-
244
-
245
-
246
-
247
-
248
-
249
-
250
-
251
-
252
-
 253
253 -
 254
254 -
 255
255 -
 256
256 -
 257
257 -
 258
258 -
 259
259 -
 260
260 -
 261
261 -
 262
262 -
 263
263 -
 264
264 -
 265
265 -
 266
266 -
 267
267 -
 268
268
 |
 |

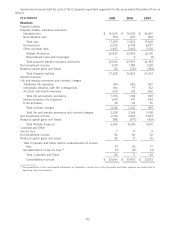
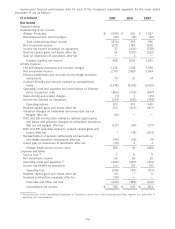
Additional significant financial performance data for each of the Company’s reportable segments for the years
ended December 31 are as follows:
($ in millions) 2011 2010 2009
Amortization of DAC
Property-Liability $ 3,640 $ 3,678 $ 3,789
Allstate Financial 593 356 965
Consolidated $ 4,233 $ 4,034 $ 4,754
Income tax expense
Property-Liability $ 4 $ 314 $ 612
Allstate Financial 286 8 (82)
Corporate and Other (118) (124) (136)
Consolidated $ 172 $ 198 $ 394
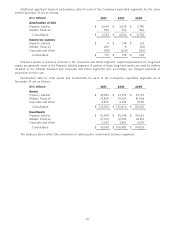
Interest expense is primarily incurred in the Corporate and Other segment. Capital expenditures for long-lived
assets are generally made in the Property-Liability segment. A portion of these long-lived assets are used by entities
included in the Allstate Financial and Corporate and Other segments and, accordingly, are charged expenses in
proportion to their use.
Summarized data for total assets and investments for each of the Company’s reportable segments as of
December 31 are as follows:
($ in millions) 2011 2010 2009
Assets
Property-Liability $ 49,833 $ 47,573 $ 47,179
Allstate Financial 72,854 79,069 81,968
Corporate and Other 2,876 4,232 3,505
Consolidated $ 125,563 $ 130,874 $ 132,652
Investments
Property-Liability $ 35,998 $ 35,048 $ 34,526
Allstate Financial 57,373 61,582 62,216
Corporate and Other 2,247 3,853 3,091
Consolidated $ 95,618 $ 100,483 $ 99,833
The balances above reflect the elimination of related party investments between segments.
177