Allstate 2012 Annual Report Download - page 169
Download and view the complete annual report
Please find page 169 of the 2012 Allstate annual report below. You can navigate through the pages in the report by either clicking on the pages listed below, or by using the keyword search tool below to find specific information within the annual report.-
 1
1 -
2
-
3
-
4
-
5
-
6
-
7
-
8
-
9
-
10
-
11
-
12
-
13
-
14
-
15
-
16
-
17
-
18
-
19
-
20
-
21
-
22
-
23
-
24
-
25
-
26
-
27
-
28
-
29
-
30
-
31
-
32
-
33
-
34
-
35
-
36
-
37
-
38
-
39
-
40
-
41
-
42
-
43
-
44
-
45
-
46
-
47
-
48
-
49
-
50
-
51
-
52
-
53
-
54
-
55
-
56
-
57
-
58
-
59
-
60
-
61
-
62
-
63
-
64
-
65
-
66
-
67
-
68
-
69
-
70
-
71
-
72
-
73
-
74
-
75
-
76
-
77
-
78
-
79
-
80
-
81
-
82
-
83
-
84
-
85
-
86
-
87
-
88
-
89
-
90
-
91
-
92
-
93
-
94
-
95
-
96
-
97
-
98
-
99
-
100
-
101
-
102
-
103
-
104
-
105
-
106
-
107
-
108
-
109
-
110
-
111
-
112
-
113
-
114
-
115
-
116
-
117
-
118
-
119
-
120
-
121
-
122
-
123
-
124
-
125
-
126
-
127
-
128
-
129
-
130
-
131
-
132
-
133
-
134
-
135
-
136
-
137
-
138
-
139
-
140
-
141
-
142
-
143
-
144
-
145
-
146
-
147
-
148
-
149
-
150
-
151
-
152
-
153
-
154
-
155
-
156
-
157
-
158
-
 159
159 -
 160
160 -
 161
161 -
 162
162 -
 163
163 -
 164
164 -
 165
165 -
 166
166 -
 167
167 -
 168
168 -
 169
169 -
 170
170 -
 171
171 -
 172
172 -
 173
173 -
 174
174 -
 175
175 -
 176
176 -
 177
177 -
 178
178 -
 179
179 -
180
-
181
-
182
-
183
-
184
-
185
-
186
-
187
-
188
-
189
-
190
-
191
-
192
-
193
-
194
-
195
-
196
-
197
-
198
-
199
-
200
-
201
-
202
-
203
-
204
-
205
-
206
-
207
-
208
-
209
-
210
-
211
-
212
-
213
-
214
-
215
-
216
-
217
-
218
-
219
-
220
-
221
-
222
-
223
-
224
-
225
-
226
-
227
-
228
-
229
-
230
-
231
-
232
-
233
-
234
-
235
-
236
-
237
-
238
-
239
-
240
-
241
-
242
-
243
-
244
-
245
-
246
-
247
-
248
-
249
-
250
-
251
-
252
-
253
-
254
-
255
-
256
-
257
-
258
-
259
-
260
-
261
-
262
-
263
-
264
-
265
-
266
-
267
-
268
 |
 |
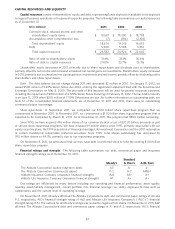
Equity price risk is the risk that we will incur losses due to adverse changes in the general levels of the equity
markets. As of December 31, 2011, we held $4.26 billion in common stocks and exchange traded and mutual funds and
$4.82 billion in other securities with equity risk (including primarily limited partnership interests, non-redeemable
preferred securities and equity-linked notes), compared to $4.67 billion and $4.88 billion, respectively, as of
December 31, 2010. 95.7% and 63.3% of these totals, respectively, represented assets of the Property-Liability
operations as of December 31, 2011, compared to 95.5% and 63.1%, respectively, as of December 31, 2010.
As of December 31, 2011, our portfolio of common stocks and other securities with equity risk had a cash market
portfolio beta of 0.72, compared to a beta of 0.74 as of December 31, 2010. Beta represents a widely used methodology
to describe, quantitatively, an investment’s market risk characteristics relative to an index such as the S&P 500. Based
on the beta analysis, we estimate that if the S&P 500 increases or decreases by 10%, the fair value of our equity
investments will increase or decrease by 7.2%, respectively. Based upon the information and assumptions we used to
calculate beta as of December 31, 2011, we estimate that an immediate decrease in the S&P 500 of 10% would decrease
the net fair value of our equity investments identified above by $652 million, compared to $695 million as of
December 31, 2010, and an immediate increase in the S&P 500 of 10% would increase the net fair value by $654 million
compared to $708 million as of December 31, 2010. In calculating the impact of a 10% S&P index perturbation on the
value of the puts, we have assumed index volatility remains constant. The selection of a 10% immediate decrease or
increase in the S&P 500 should not be construed as our prediction of future market events, but only as an illustration of
the potential effect of such an event.
The beta of our common stocks and other securities with equity risk was determined by calculating the change in
the fair value of the portfolio resulting from stressing the equity market up and down 10%. The illustrations noted above
may not reflect our actual experience if the future composition of the portfolio (hence its beta) and correlation
relationships differ from the historical relationships.
As of December 31, 2011 and 2010, we had separate accounts assets related to variable annuity and variable life
contracts with account values totaling $6.98 billion and $8.68 billion, respectively. Equity risk exists for contract charges
based on separate account balances and guarantees for death and/or income benefits provided by our variable
products. In 2006, we disposed of substantially all of the variable annuity business through reinsurance agreements
with The Prudential Insurance Company of America, a subsidiary of Prudential Financial Inc. and therefore mitigated this
aspect of our risk. Equity risk for our variable life business relates to contract charges and policyholder benefits. Total
variable life contract charges for 2011 and 2010 were $76 million and $80 million, respectively. Separate account
liabilities related to variable life contracts were $716 million and $775 million in December 31, 2011 and 2010,
respectively.
As of December 31, 2011 and 2010 we had $3.86 billion and $4.70 billion, respectively, in equity-indexed annuity
liabilities that provide customers with interest crediting rates based on the performance of the S&P 500. We hedge the
majority of the risk associated with these liabilities using equity-indexed options and futures, interest rate swaps, and
eurodollar futures, maintaining risk within specified value-at-risk limits.
Foreign currency exchange rate risk is the risk that we will incur economic losses due to adverse changes in foreign
currency exchange rates. This risk primarily arises from our foreign equity investments, including real estate funds and
private equity funds, and our Canadian and Northern Ireland operations. We also have certain fixed income securities
that are denominated in foreign currencies; however, derivatives are used to hedge the foreign currency risk of
approximately 38% of the fixed income securities.
As of December 31, 2011, we had $1.24 billion in foreign currency denominated equity investments, $786 million net
investment in our foreign subsidiaries, and $363 million in unhedged non-dollar pay fixed income securities. These
amounts were $1.70 billion, $773 million, and $91 million, respectively, as of December 31, 2010. 90.0% of the foreign
currency exposure is in the Property-Liability business.
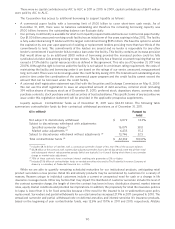
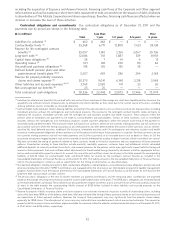
Based upon the information and assumptions used as of December 31, 2011, we estimate that a 10% immediate
unfavorable change in each of the foreign currency exchange rates to which we are exposed would decrease the value of
our foreign currency denominated instruments by $225 million, compared with an estimated $257 million decrease as
of December 31, 2010. The selection of a 10% immediate decrease in all currency exchange rates should not be
construed as our prediction of future market events, but only as an illustration of the potential effect of such an event.
Our currency exposure is diversified across 33 currencies as of December 31, 2011, compared to 32 currencies as of
December 31, 2010. Our largest individual foreign currency exposures as of December 31, 2011 were to the Canadian
dollar (39.6%) and the Japanese Yen (10.4%). The largest individual foreign currency exposures as of December 31,
83