Allstate 2012 Annual Report Download - page 168
Download and view the complete annual report
Please find page 168 of the 2012 Allstate annual report below. You can navigate through the pages in the report by either clicking on the pages listed below, or by using the keyword search tool below to find specific information within the annual report.-
 1
1 -
2
-
3
-
4
-
5
-
6
-
7
-
8
-
9
-
10
-
11
-
12
-
13
-
14
-
15
-
16
-
17
-
18
-
19
-
20
-
21
-
22
-
23
-
24
-
25
-
26
-
27
-
28
-
29
-
30
-
31
-
32
-
33
-
34
-
35
-
36
-
37
-
38
-
39
-
40
-
41
-
42
-
43
-
44
-
45
-
46
-
47
-
48
-
49
-
50
-
51
-
52
-
53
-
54
-
55
-
56
-
57
-
58
-
59
-
60
-
61
-
62
-
63
-
64
-
65
-
66
-
67
-
68
-
69
-
70
-
71
-
72
-
73
-
74
-
75
-
76
-
77
-
78
-
79
-
80
-
81
-
82
-
83
-
84
-
85
-
86
-
87
-
88
-
89
-
90
-
91
-
92
-
93
-
94
-
95
-
96
-
97
-
98
-
99
-
100
-
101
-
102
-
103
-
104
-
105
-
106
-
107
-
108
-
109
-
110
-
111
-
112
-
113
-
114
-
115
-
116
-
117
-
118
-
119
-
120
-
121
-
122
-
123
-
124
-
125
-
126
-
127
-
128
-
129
-
130
-
131
-
132
-
133
-
134
-
135
-
136
-
137
-
138
-
139
-
140
-
141
-
142
-
143
-
144
-
145
-
146
-
147
-
148
-
149
-
150
-
151
-
152
-
153
-
154
-
155
-
156
-
157
-
 158
158 -
 159
159 -
 160
160 -
 161
161 -
 162
162 -
 163
163 -
 164
164 -
 165
165 -
 166
166 -
 167
167 -
 168
168 -
 169
169 -
 170
170 -
 171
171 -
 172
172 -
 173
173 -
 174
174 -
 175
175 -
 176
176 -
 177
177 -
 178
178 -
179
-
180
-
181
-
182
-
183
-
184
-
185
-
186
-
187
-
188
-
189
-
190
-
191
-
192
-
193
-
194
-
195
-
196
-
197
-
198
-
199
-
200
-
201
-
202
-
203
-
204
-
205
-
206
-
207
-
208
-
209
-
210
-
211
-
212
-
213
-
214
-
215
-
216
-
217
-
218
-
219
-
220
-
221
-
222
-
223
-
224
-
225
-
226
-
227
-
228
-
229
-
230
-
231
-
232
-
233
-
234
-
235
-
236
-
237
-
238
-
239
-
240
-
241
-
242
-
243
-
244
-
245
-
246
-
247
-
248
-
249
-
250
-
251
-
252
-
253
-
254
-
255
-
256
-
257
-
258
-
259
-
260
-
261
-
262
-
263
-
264
-
265
-
266
-
267
-
268
 |
 |
This philosophy is executed using duration targets for fixed income investments in addition to interest rate swaps,
futures, forwards, caps, floors and swaptions to reduce the interest rate risk resulting from mismatches between existing
assets and liabilities, and financial futures and other derivative instruments to hedge the interest rate risk of anticipated
purchases and sales of investments and product sales to customers.
Based upon the information and assumptions used in the duration calculation, and interest rates in effect as of
December 31, 2011, we estimate that a 100 basis point immediate, parallel increase in interest rates (‘‘rate shock’’)
would decrease the net fair value of the assets and liabilities by $127 million, compared to a decrease of $36 million as of
December 31, 2010, reflecting year to year changes in duration. Reflected in the duration calculation are the effects of a
program that uses swaps, eurodollar futures, options on Treasury futures and interest rate swaptions to manage interest
rate risk. In calculating the impact of a 100 basis point increase on the value of the derivatives, we have assumed interest
rate volatility remains constant. Based on the swaps, eurodollar futures, options on Treasury futures and interest rate
swaptions in place as of December 31, 2011, we would recognize realized capital losses totaling $14 million in the event
of a 100 basis point immediate, parallel interest rate increase and $15 million in realized capital gains in the event of a
100 basis point immediate, parallel interest rate decrease on these derivatives. The selection of a 100 basis point
immediate, parallel change in interest rates should not be construed as our prediction of future market events, but only
as an illustration of the potential effect of such an event. There are $10.49 billion of assets supporting life insurance
products such as traditional and interest-sensitive life that are not financial instruments. These assets and the
associated liabilities have not been included in the above estimate. The $10.49 billion of assets excluded from the
calculation has increased from $9.60 billion as of December 31, 2010, due to an increase in interest-sensitive life
contractholder funds and improved fixed income valuations as a result of declining risk-free interest rates and tightening
of credit spreads in certain sectors. Based on assumptions described above, in the event of a 100 basis point immediate
increase in interest rates, the assets supporting life insurance products would decrease in value by $660 million,
compared to a decrease of $549 million as of December 31, 2010.
To the extent that conditions differ from the assumptions we used in these calculations, duration and rate shock
measures could be significantly impacted. Additionally, our calculations assume that the current relationship between
short-term and long-term interest rates (the term structure of interest rates) will remain constant over time. As a result,
these calculations may not fully capture the effect of non-parallel changes in the term structure of interest rates and/or
large changes in interest rates.
We pledge and receive collateral on certain types of derivative contracts. For over-the-counter (‘‘OTC’’) derivative
transactions, master netting agreements are used. These agreements allow us to net payments due for transactions
covered by the agreements and, when applicable, we are required to post collateral. As of December 31, 2011, we held
$64 million of cash and securities pledged by counterparties as collateral for OTC instruments, and we pledged
$82 million of cash and securities as collateral to counterparties. We performed a sensitivity analysis on OTC derivative
collateral by assuming a hypothetical 100 basis point decline in interest rates. The analysis indicated that we would have
to post an estimated $2 million in additional collateral. The selection of these hypothetical scenarios should not be
construed as our prediction of future events, but only as an illustration of the estimated potential effect of such events.
We also actively manage our counterparty credit risk exposure by monitoring the level of collateral posted by our
counterparties with respect to our receivable positions.
Credit spread risk is the risk that we will incur a loss due to adverse changes in credit spreads (‘‘spreads’’). This risk
arises from many of our primary activities, as we invest substantial funds in spread-sensitive fixed income assets.
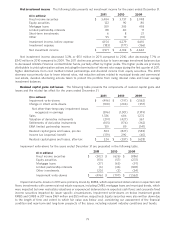
We manage the spread risk in our assets. One of the measures used to quantify this exposure is spread duration.
Spread duration measures the price sensitivity of the assets to changes in spreads. For example, if spreads increase 100
basis points, the fair value of an asset exhibiting a spread duration of 5 is expected to decrease in value by 5%.
Spread duration is calculated similarly to interest rate duration. As of December 31, 2011, the spread duration of
Property-Liability assets was 4.77, compared to 4.45 as of December 31, 2010, and the spread duration of Allstate
Financial assets was 5.58, compared to 4.97 as of December 31, 2010. Based upon the information and assumptions we
use in this spread duration calculation, and spreads in effect as of December 31, 2011, we estimate that a 100 basis point
immediate, parallel increase in spreads across all asset classes, industry sectors and credit ratings (‘‘spread shock’’)
would decrease the net fair value of the assets by $4.10 billion, compared to $3.61 billion as of December 31, 2010.
Reflected in the duration calculation are the effects of our risk mitigation actions that use CDS to manage spread risk.
The selection of a 100 basis point immediate parallel change in spreads should not be construed as our prediction of
future market events, but only as an illustration of the potential effect of such an event.
82