Allstate 2012 Annual Report Download - page 211
Download and view the complete annual report
Please find page 211 of the 2012 Allstate annual report below. You can navigate through the pages in the report by either clicking on the pages listed below, or by using the keyword search tool below to find specific information within the annual report.-
 1
1 -
2
-
3
-
4
-
5
-
6
-
7
-
8
-
9
-
10
-
11
-
12
-
13
-
14
-
15
-
16
-
17
-
18
-
19
-
20
-
21
-
22
-
23
-
24
-
25
-
26
-
27
-
28
-
29
-
30
-
31
-
32
-
33
-
34
-
35
-
36
-
37
-
38
-
39
-
40
-
41
-
42
-
43
-
44
-
45
-
46
-
47
-
48
-
49
-
50
-
51
-
52
-
53
-
54
-
55
-
56
-
57
-
58
-
59
-
60
-
61
-
62
-
63
-
64
-
65
-
66
-
67
-
68
-
69
-
70
-
71
-
72
-
73
-
74
-
75
-
76
-
77
-
78
-
79
-
80
-
81
-
82
-
83
-
84
-
85
-
86
-
87
-
88
-
89
-
90
-
91
-
92
-
93
-
94
-
95
-
96
-
97
-
98
-
99
-
100
-
101
-
102
-
103
-
104
-
105
-
106
-
107
-
108
-
109
-
110
-
111
-
112
-
113
-
114
-
115
-
116
-
117
-
118
-
119
-
120
-
121
-
122
-
123
-
124
-
125
-
126
-
127
-
128
-
129
-
130
-
131
-
132
-
133
-
134
-
135
-
136
-
137
-
138
-
139
-
140
-
141
-
142
-
143
-
144
-
145
-
146
-
147
-
148
-
149
-
150
-
151
-
152
-
153
-
154
-
155
-
156
-
157
-
158
-
159
-
160
-
161
-
162
-
163
-
164
-
165
-
166
-
167
-
168
-
169
-
170
-
171
-
172
-
173
-
174
-
175
-
176
-
177
-
178
-
179
-
180
-
181
-
182
-
183
-
184
-
185
-
186
-
187
-
188
-
189
-
190
-
191
-
192
-
193
-
194
-
195
-
196
-
197
-
198
-
199
-
200
-
 201
201 -
 202
202 -
 203
203 -
 204
204 -
 205
205 -
 206
206 -
 207
207 -
 208
208 -
 209
209 -
 210
210 -
 211
211 -
 212
212 -
 213
213 -
 214
214 -
 215
215 -
 216
216 -
 217
217 -
 218
218 -
 219
219 -
 220
220 -
 221
221 -
222
-
223
-
224
-
225
-
226
-
227
-
228
-
229
-
230
-
231
-
232
-
233
-
234
-
235
-
236
-
237
-
238
-
239
-
240
-
241
-
242
-
243
-
244
-
245
-
246
-
247
-
248
-
249
-
250
-
251
-
252
-
253
-
254
-
255
-
256
-
257
-
258
-
259
-
260
-
261
-
262
-
263
-
264
-
265
-
266
-
267
-
268
 |
 |

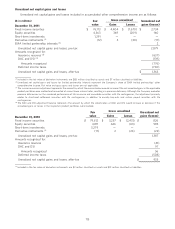
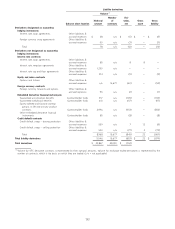
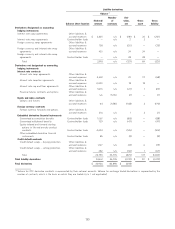
The following table summarizes the Company’s assets and liabilities measured at fair value on a recurring and
non-recurring basis as of December 31, 2010:
Quoted prices
($ in millions) in active Significant
markets for other Significant Counterparty Balance
identical observable unobservable and cash as of
assets inputs inputs collateral December 31,
(Level 1) (Level 2) (Level 3) netting 2010
Assets
Fixed income securities:
U.S. government and agencies $ 4,976 $ 3,620 $ — $ 8,596
Municipal — 13,918 2,016 15,934
Corporate — 35,747 1,908 37,655
Foreign government — 3,158 — 3,158
RMBS — 6,199 1,794 7,993
CMBS — 1,071 923 1,994
ABS — 1,827 2,417 4,244
Redeemable preferred stock — 37 1 38
Total fixed income securities 4,976 65,577 9,059 79,612
Equity securities 4,316 432 63 4,811
Short-term investments 174 3,105 — 3,279
Other investments:
Free-standing derivatives — 651 74 $ (286) 439
Separate account assets 8,676 — — 8,676
Other assets — — 1 1
Total recurring basis assets 18,142 69,765 9,197 (286) 96,818
Non-recurring basis (1) — — 120 120
Total assets at fair value $ 18,142 $ 69,765 $ 9,317 $ (286) $ 96,938
% of total assets at fair value 18.7% 72.0% 9.6% (0.3)% 100.0%
Liabilities
Contractholder funds:
Derivatives embedded in life and annuity
contracts $ — $ — $ (653) $ (653)
Other liabilities:
Free-standing derivatives (2) (529) (95) $ 263 (363)
Total liabilities at fair value $ (2) $ (529) $ (748) $ 263 $ (1,016)
% of total liabilities at fair value 0.2% 52.1% 73.6% (25.9)% 100.0%
(1) Includes $111 million of mortgage loans and $9 million of limited partnership interests written-down to fair value in connection with recognizing
other-than-temporary impairments.
125