Allstate 2012 Annual Report Download - page 133
Download and view the complete annual report
Please find page 133 of the 2012 Allstate annual report below. You can navigate through the pages in the report by either clicking on the pages listed below, or by using the keyword search tool below to find specific information within the annual report.-
 1
1 -
 2
2 -
 3
3 -
 4
4 -
 5
5 -
 6
6 -
 7
7 -
 8
8 -
 9
9 -
 10
10 -
 11
11 -
 12
12 -
 13
13 -
 14
14 -
 15
15 -
 16
16 -
 17
17 -
 18
18 -
 19
19 -
 20
20 -
 21
21 -
 22
22 -
 23
23 -
 24
24 -
 25
25 -
 26
26 -
 27
27 -
 28
28 -
 29
29 -
 30
30 -
 31
31 -
 32
32 -
 33
33 -
 34
34 -
 35
35 -
 36
36 -
 37
37 -
 38
38 -
 39
39 -
 40
40 -
 41
41 -
 42
42 -
 43
43 -
 44
44 -
 45
45 -
 46
46 -
 47
47 -
 48
48 -
 49
49 -
 50
50 -
 51
51 -
 52
52 -
 53
53 -
 54
54 -
 55
55 -
 56
56 -
 57
57 -
 58
58 -
 59
59 -
 60
60 -
 61
61 -
 62
62 -
 63
63 -
 64
64 -
 65
65 -
 66
66 -
 67
67 -
 68
68 -
 69
69 -
 70
70 -
 71
71 -
 72
72 -
 73
73 -
 74
74 -
 75
75 -
 76
76 -
 77
77 -
 78
78 -
 79
79 -
 80
80 -
 81
81 -
 82
82 -
 83
83 -
 84
84 -
 85
85 -
 86
86 -
 87
87 -
 88
88 -
 89
89 -
 90
90 -
 91
91 -
 92
92 -
 93
93 -
 94
94 -
 95
95 -
 96
96 -
 97
97 -
 98
98 -
 99
99 -
 100
100 -
 101
101 -
 102
102 -
 103
103 -
 104
104 -
 105
105 -
 106
106 -
 107
107 -
 108
108 -
 109
109 -
 110
110 -
 111
111 -
 112
112 -
 113
113 -
 114
114 -
 115
115 -
 116
116 -
 117
117 -
 118
118 -
 119
119 -
 120
120 -
 121
121 -
 122
122 -
 123
123 -
 124
124 -
 125
125 -
 126
126 -
 127
127 -
 128
128 -
 129
129 -
 130
130 -
 131
131 -
 132
132 -
 133
133 -
 134
134 -
 135
135 -
 136
136 -
 137
137 -
 138
138 -
 139
139 -
 140
140 -
 141
141 -
 142
142 -
 143
143 -
 144
144 -
 145
145 -
 146
146 -
 147
147 -
 148
148 -
 149
149 -
 150
150 -
 151
151 -
 152
152 -
 153
153 -
 154
154 -
 155
155 -
 156
156 -
 157
157 -
 158
158 -
 159
159 -
 160
160 -
 161
161 -
 162
162 -
 163
163 -
 164
164 -
 165
165 -
 166
166 -
 167
167 -
 168
168 -
 169
169 -
 170
170 -
 171
171 -
 172
172 -
 173
173 -
 174
174 -
 175
175 -
 176
176 -
 177
177 -
 178
178 -
 179
179 -
 180
180 -
 181
181 -
 182
182 -
 183
183 -
 184
184 -
 185
185 -
 186
186 -
 187
187 -
 188
188 -
 189
189 -
 190
190 -
 191
191 -
 192
192 -
 193
193 -
 194
194 -
 195
195 -
 196
196 -
 197
197 -
 198
198 -
 199
199 -
 200
200 -
 201
201 -
 202
202 -
 203
203 -
 204
204 -
 205
205 -
 206
206 -
 207
207 -
 208
208 -
 209
209 -
 210
210 -
 211
211 -
 212
212 -
 213
213 -
 214
214 -
 215
215 -
 216
216 -
 217
217 -
 218
218 -
 219
219 -
 220
220 -
 221
221 -
 222
222 -
 223
223 -
 224
224 -
 225
225 -
 226
226 -
 227
227 -
 228
228 -
 229
229 -
 230
230 -
 231
231 -
 232
232 -
 233
233 -
 234
234 -
 235
235 -
 236
236 -
 237
237 -
 238
238 -
 239
239 -
 240
240 -
 241
241 -
 242
242 -
 243
243 -
 244
244 -
 245
245 -
 246
246 -
 247
247 -
 248
248 -
 249
249 -
 250
250 -
 251
251 -
 252
252 -
 253
253 -
 254
254 -
 255
255 -
 256
256 -
 257
257 -
 258
258 -
 259
259 -
 260
260 -
 261
261 -
 262
262 -
 263
263 -
 264
264 -
 265
265 -
 266
266 -
 267
267 -
 268
268
 |
 |

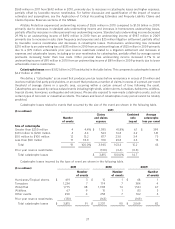
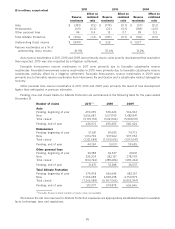
The impact of these reestimates on the Allstate brand underwriting (loss) income is shown in the table below.
($ in millions) 2011 2010 2009
Reserve reestimates $ (371) $ (181) $ (126)
Allstate brand underwriting (loss) income (666) 569 1,022
Reserve reestimates as a % of underwriting (loss) income 55.7% 31.8% 12.3%
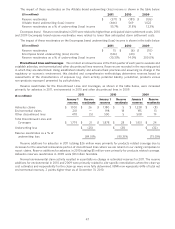
Encompass brand Reserve reestimates in 2011 were related to higher than anticipated claim settlement costs. 2010
and 2009 Encompass brand reserve reestimates were related to lower than anticipated claim settlement costs.
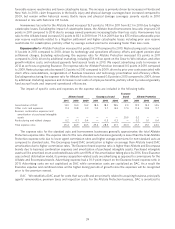
The impact of these reestimates on the Encompass brand underwriting (loss) income is shown in the table below.
($ in millions) 2011 2010 2009
Reserve reestimates $ 15 $ (6) $ (10)
Encompass brand underwriting (loss) income (146) (43) 5
Reserve reestimates as a % of underwriting (loss) income (10.3)% 14.0% 200.0%
Discontinued Lines and Coverages We conduct an annual review in the third quarter of each year to evaluate and
establish asbestos, environmental and other discontinued lines reserves. Reserves are recorded in the reporting period
in which they are determined. Using established industry and actuarial best practices and assuming no change in the
regulatory or economic environment, this detailed and comprehensive methodology determines reserves based on
assessments of the characteristics of exposure (e.g. claim activity, potential liability, jurisdiction, products versus
non-products exposure) presented by policyholders.
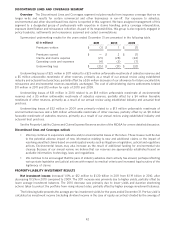
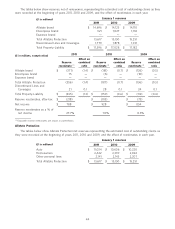
Reserve reestimates for the Discontinued Lines and Coverages, as shown in the table below, were increased
primarily for asbestos in 2011, environmental in 2010 and other discontinued lines in 2009.
2011 2010 2009
($ in millions)
January 1 Reserve January 1 Reserve January 1 Reserve
reserves reestimate reserves reestimate reserves reestimate
Asbestos claims $ 1,100 $ 26 $ 1,180 $ 5 $ 1,228 $ (8)
Environmental claims 201 — 198 18 195 13
Other discontinued lines 478 (5) 500 5 508 19
Total Discontinued Lines and
Coverages $ 1,779 $ 21 $ 1,878 $ 28 $ 1,931 $ 24
Underwriting loss $ (25) $ (31) $ (32)
Reserve reestimates as a % of
underwriting loss (84.0)% (90.3)% (75.0)%
Reserve additions for asbestos in 2011 totaling $26 million were primarily for products related coverage due to
increases for the assumed reinsurance portion of discontinued lines where we are reliant on our ceding companies to
report claims. Reserve additions for asbestos in 2010 totaling $5 million were primarily for products related coverage.
Asbestos reserves reestimates in 2009 were $8 million favorable.
Normal environmental claim activity resulted in essentially no change in estimated reserves for 2011. The reserve
additions for environmental in 2010 and 2009 were primarily related to site-specific remediations where the clean-up
cost estimates and responsibility for the clean-up were more fully determined. IBNR now represents 64% of total net
environmental reserves, 2 points higher than as of December 31, 2010.
47
