Allstate 2012 Annual Report Download - page 108
Download and view the complete annual report
Please find page 108 of the 2012 Allstate annual report below. You can navigate through the pages in the report by either clicking on the pages listed below, or by using the keyword search tool below to find specific information within the annual report.-
 1
1 -
2
-
3
-
4
-
5
-
6
-
7
-
8
-
9
-
10
-
11
-
12
-
13
-
14
-
15
-
16
-
17
-
18
-
19
-
20
-
21
-
22
-
23
-
24
-
25
-
26
-
27
-
28
-
29
-
30
-
31
-
32
-
33
-
34
-
35
-
36
-
37
-
38
-
39
-
40
-
41
-
42
-
43
-
44
-
45
-
46
-
47
-
48
-
49
-
50
-
51
-
52
-
53
-
54
-
55
-
56
-
57
-
58
-
59
-
60
-
61
-
62
-
63
-
64
-
65
-
66
-
67
-
68
-
69
-
70
-
71
-
72
-
73
-
74
-
75
-
76
-
77
-
78
-
79
-
80
-
81
-
82
-
83
-
84
-
85
-
86
-
87
-
88
-
89
-
90
-
91
-
92
-
93
-
94
-
95
-
96
-
97
-
 98
98 -
 99
99 -
 100
100 -
 101
101 -
 102
102 -
 103
103 -
 104
104 -
 105
105 -
 106
106 -
 107
107 -
 108
108 -
 109
109 -
 110
110 -
 111
111 -
 112
112 -
 113
113 -
 114
114 -
 115
115 -
 116
116 -
 117
117 -
 118
118 -
119
-
120
-
121
-
122
-
123
-
124
-
125
-
126
-
127
-
128
-
129
-
130
-
131
-
132
-
133
-
134
-
135
-
136
-
137
-
138
-
139
-
140
-
141
-
142
-
143
-
144
-
145
-
146
-
147
-
148
-
149
-
150
-
151
-
152
-
153
-
154
-
155
-
156
-
157
-
158
-
159
-
160
-
161
-
162
-
163
-
164
-
165
-
166
-
167
-
168
-
169
-
170
-
171
-
172
-
173
-
174
-
175
-
176
-
177
-
178
-
179
-
180
-
181
-
182
-
183
-
184
-
185
-
186
-
187
-
188
-
189
-
190
-
191
-
192
-
193
-
194
-
195
-
196
-
197
-
198
-
199
-
200
-
201
-
202
-
203
-
204
-
205
-
206
-
207
-
208
-
209
-
210
-
211
-
212
-
213
-
214
-
215
-
216
-
217
-
218
-
219
-
220
-
221
-
222
-
223
-
224
-
225
-
226
-
227
-
228
-
229
-
230
-
231
-
232
-
233
-
234
-
235
-
236
-
237
-
238
-
239
-
240
-
241
-
242
-
243
-
244
-
245
-
246
-
247
-
248
-
249
-
250
-
251
-
252
-
253
-
254
-
255
-
256
-
257
-
258
-
259
-
260
-
261
-
262
-
263
-
264
-
265
-
266
-
267
-
268
 |
 |
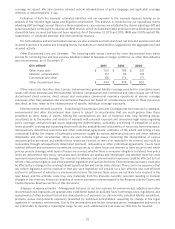
estimation techniques previously described. In the normal course of business, we may also supplement our claims
processes by utilizing third party adjusters, appraisers, engineers, inspectors, and other professionals and information
sources to assess and settle catastrophe and non-catastrophe related claims.
Historically, the case reserves set by the field adjusting staff have not proven to be an entirely accurate estimate of
the ultimate cost of claims. To provide for this, a development reserve is estimated using previously described
processes, and allocated to pending claims as a supplement to case reserves. Typically, the case and supplemental
development reserves comprise about 90% of total reserves.
Another major component of reserves is IBNR. Typically, IBNR comprises about 10% of total reserves.
Generally, the initial reserves for a new accident year are established based on severity assumptions for different
business segments, lines and coverages based on historical relationships to relevant inflation indicators, and reserves for
prior accident years are statistically determined using processes previously described. Changes in auto current year
claim severity are generally influenced by inflation in the medical and auto repair sectors of the economy. We mitigate
these effects through various loss management programs. Injury claims are affected largely by medical cost inflation
while physical damage claims are affected largely by auto repair cost inflation and used car prices. For auto physical
damage coverages, we monitor our rate of increase in average cost per claim against a weighted average of the
Maintenance and Repair price index and the Parts and Equipment price index. We believe our claim settlement
initiatives, such as improvements to the claim review and settlement process, the use of special investigative units to
detect fraud and handle suspect claims, litigation management and defense strategies, as well as various other loss
management initiatives underway, contribute to the mitigation of injury and physical damage severity trends.
Changes in homeowners current year claim severity are generally influenced by inflation in the cost of building
materials, the cost of construction and property repair services, the cost of replacing home furnishings and other
contents, the types of claims that qualify for coverage, deductibles and other economic and environmental factors. We
employ various loss management programs to mitigate the effect of these factors.
As loss experience for the current year develops for each type of loss, it is monitored relative to initial assumptions
until it is judged to have sufficient statistical credibility. From that point in time and forward, reserves are reestimated
using statistical actuarial processes to reflect the impact actual loss trends have on development factors incorporated
into the actuarial estimation processes. Statistical credibility is usually achieved by the end of the first calendar year;
however, when trends for the current accident year exceed initial assumptions sooner, they are usually determined to be
credible, and reserves are increased accordingly.
The very detailed processes for developing reserve estimates, and the lack of a need and existence of a common set
of assumptions or development factors, limits aggregate reserve level testing for variability of data elements. However,
by applying standard actuarial methods to consolidated historic accident year loss data for major loss types, comprising
auto injury losses, auto physical damage losses and homeowner losses, we develop variability analyses consistent with
the way we develop reserves by measuring the potential variability of development factors, as described in the section
titled ‘‘Potential Reserve Estimate Variability’’ below.
Causes of reserve estimate uncertainty Since reserves are estimates of unpaid portions of claims and claims
expenses that have occurred, including IBNR losses, the establishment of appropriate reserves, including reserves for
catastrophes, requires regular reevaluation and refinement of estimates to determine our ultimate loss estimate.
At each reporting date, the highest degree of uncertainty in estimates of losses arises from claims remaining to be
settled for the current accident year and the most recent preceding accident year. The greatest degree of uncertainty
exists in the current accident year because the current accident year contains the greatest proportion of losses that have
not been reported or settled but must be estimated as of the current reporting date. Most of these losses relate to
damaged property such as automobiles and homes, and medical care for injuries from accidents. During the first year
after the end of an accident year, a large portion of the total losses for that accident year are settled. When accident year
losses paid through the end of the first year following the initial accident year are incorporated into updated actuarial
estimates, the trends inherent in the settlement of claims emerge more clearly. Consequently, this is the point in time at
which we tend to make our largest reestimates of losses for an accident year. After the second year, the losses that we
pay for an accident year typically relate to claims that are more difficult to settle, such as those involving serious injuries
or litigation. Private passenger auto insurance provides a good illustration of the uncertainty of future loss estimates: our
typical annual percentage payout of reserves for an accident year is approximately 45% in the first year after the end of
the accident year, 20% in the second year, 15% in the third year, 10% in the fourth year, and the remaining 10%
thereafter.
22