Allstate 2012 Annual Report Download - page 201
Download and view the complete annual report
Please find page 201 of the 2012 Allstate annual report below. You can navigate through the pages in the report by either clicking on the pages listed below, or by using the keyword search tool below to find specific information within the annual report.-
 1
1 -
2
-
3
-
4
-
5
-
6
-
7
-
8
-
9
-
10
-
11
-
12
-
13
-
14
-
15
-
16
-
17
-
18
-
19
-
20
-
21
-
22
-
23
-
24
-
25
-
26
-
27
-
28
-
29
-
30
-
31
-
32
-
33
-
34
-
35
-
36
-
37
-
38
-
39
-
40
-
41
-
42
-
43
-
44
-
45
-
46
-
47
-
48
-
49
-
50
-
51
-
52
-
53
-
54
-
55
-
56
-
57
-
58
-
59
-
60
-
61
-
62
-
63
-
64
-
65
-
66
-
67
-
68
-
69
-
70
-
71
-
72
-
73
-
74
-
75
-
76
-
77
-
78
-
79
-
80
-
81
-
82
-
83
-
84
-
85
-
86
-
87
-
88
-
89
-
90
-
91
-
92
-
93
-
94
-
95
-
96
-
97
-
98
-
99
-
100
-
101
-
102
-
103
-
104
-
105
-
106
-
107
-
108
-
109
-
110
-
111
-
112
-
113
-
114
-
115
-
116
-
117
-
118
-
119
-
120
-
121
-
122
-
123
-
124
-
125
-
126
-
127
-
128
-
129
-
130
-
131
-
132
-
133
-
134
-
135
-
136
-
137
-
138
-
139
-
140
-
141
-
142
-
143
-
144
-
145
-
146
-
147
-
148
-
149
-
150
-
151
-
152
-
153
-
154
-
155
-
156
-
157
-
158
-
159
-
160
-
161
-
162
-
163
-
164
-
165
-
166
-
167
-
168
-
169
-
170
-
171
-
172
-
173
-
174
-
175
-
176
-
177
-
178
-
179
-
180
-
181
-
182
-
183
-
184
-
185
-
186
-
187
-
188
-
189
-
190
-
 191
191 -
 192
192 -
 193
193 -
 194
194 -
 195
195 -
 196
196 -
 197
197 -
 198
198 -
 199
199 -
 200
200 -
 201
201 -
 202
202 -
 203
203 -
 204
204 -
 205
205 -
 206
206 -
 207
207 -
 208
208 -
 209
209 -
 210
210 -
 211
211 -
212
-
213
-
214
-
215
-
216
-
217
-
218
-
219
-
220
-
221
-
222
-
223
-
224
-
225
-
226
-
227
-
228
-
229
-
230
-
231
-
232
-
233
-
234
-
235
-
236
-
237
-
238
-
239
-
240
-
241
-
242
-
243
-
244
-
245
-
246
-
247
-
248
-
249
-
250
-
251
-
252
-
253
-
254
-
255
-
256
-
257
-
258
-
259
-
260
-
261
-
262
-
263
-
264
-
265
-
266
-
267
-
268
 |
 |

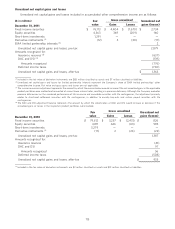
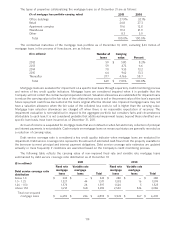
Unrealized net capital gains and losses
Unrealized net capital gains and losses included in accumulated other comprehensive income are as follows:
Gross unrealized
($ in millions) Fair Unrealized net
value Gains Losses gains (losses)
December 31, 2011
Fixed income securities $ 76,113 $ 4,404 $ (1,670) $ 2,734
Equity securities 4,363 369 (209) 160
Short-term investments 1,291 — — —
Derivative instruments (1) (12) 3 (20) (17)
EMA limited partnership interests (2) 2
Unrealized net capital gains and losses, pre-tax 2,879
Amounts recognized for:
Insurance reserves (3) (637)
DAC and DSI (4) (139)
Amounts recognized (776)
Deferred income taxes (740)
Unrealized net capital gains and losses, after-tax $ 1,363
(1) Included in the fair value of derivative instruments are $(5) million classified as assets and $7 million classified as liabilities.
(2) Unrealized net capital gains and losses for limited partnership interests represent the Company’s share of EMA limited partnerships’ other
comprehensive income. Fair value and gross gains and losses are not applicable.
(3) The insurance reserves adjustment represents the amount by which the reserve balance would increase if the net unrealized gains in the applicable
product portfolios were realized and reinvested at current lower interest rates, resulting in a premium deficiency. Although the Company evaluates
premium deficiencies on the combined performance of life insurance and immediate annuities with life contingencies, the adjustment primarily
relates to structured settlement annuities with life contingencies, in addition to annuity buy-outs and certain payout annuities with life
contingencies.
(4) The DAC and DSI adjustment balance represents the amount by which the amortization of DAC and DSI would increase or decrease if the
unrealized gains or losses in the respective product portfolios were realized.
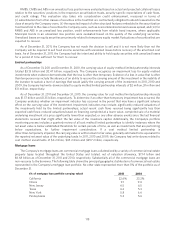
Gross unrealized
Fair Unrealized net
value Gains Losses gains (losses)
December 31, 2010
Fixed income securities $ 79,612 $ 3,257 $ (2,431) $ 826
Equity securities 4,811 646 (63) 583
Short-term investments 3,279 — — —
Derivative instruments (1) (17) 2 (24) (22)
Unrealized net capital gains and losses, pre-tax 1,387
Amounts recognized for:
Insurance reserves (41)
DAC and DSI 97
Amounts recognized 56
Deferred income taxes (508)
Unrealized net capital gains and losses, after-tax $ 935
(1) Included in the fair value of derivative instruments are $2 million classified as assets and $19 million classified as liabilities.
115