Allstate 2012 Annual Report Download - page 185
Download and view the complete annual report
Please find page 185 of the 2012 Allstate annual report below. You can navigate through the pages in the report by either clicking on the pages listed below, or by using the keyword search tool below to find specific information within the annual report.-
 1
1 -
2
-
3
-
4
-
5
-
6
-
7
-
8
-
9
-
10
-
11
-
12
-
13
-
14
-
15
-
16
-
17
-
18
-
19
-
20
-
21
-
22
-
23
-
24
-
25
-
26
-
27
-
28
-
29
-
30
-
31
-
32
-
33
-
34
-
35
-
36
-
37
-
38
-
39
-
40
-
41
-
42
-
43
-
44
-
45
-
46
-
47
-
48
-
49
-
50
-
51
-
52
-
53
-
54
-
55
-
56
-
57
-
58
-
59
-
60
-
61
-
62
-
63
-
64
-
65
-
66
-
67
-
68
-
69
-
70
-
71
-
72
-
73
-
74
-
75
-
76
-
77
-
78
-
79
-
80
-
81
-
82
-
83
-
84
-
85
-
86
-
87
-
88
-
89
-
90
-
91
-
92
-
93
-
94
-
95
-
96
-
97
-
98
-
99
-
100
-
101
-
102
-
103
-
104
-
105
-
106
-
107
-
108
-
109
-
110
-
111
-
112
-
113
-
114
-
115
-
116
-
117
-
118
-
119
-
120
-
121
-
122
-
123
-
124
-
125
-
126
-
127
-
128
-
129
-
130
-
131
-
132
-
133
-
134
-
135
-
136
-
137
-
138
-
139
-
140
-
141
-
142
-
143
-
144
-
145
-
146
-
147
-
148
-
149
-
150
-
151
-
152
-
153
-
154
-
155
-
156
-
157
-
158
-
159
-
160
-
161
-
162
-
163
-
164
-
165
-
166
-
167
-
168
-
169
-
170
-
171
-
172
-
173
-
174
-
 175
175 -
 176
176 -
 177
177 -
 178
178 -
 179
179 -
 180
180 -
 181
181 -
 182
182 -
 183
183 -
 184
184 -
 185
185 -
 186
186 -
 187
187 -
 188
188 -
 189
189 -
 190
190 -
 191
191 -
 192
192 -
 193
193 -
 194
194 -
 195
195 -
196
-
197
-
198
-
199
-
200
-
201
-
202
-
203
-
204
-
205
-
206
-
207
-
208
-
209
-
210
-
211
-
212
-
213
-
214
-
215
-
216
-
217
-
218
-
219
-
220
-
221
-
222
-
223
-
224
-
225
-
226
-
227
-
228
-
229
-
230
-
231
-
232
-
233
-
234
-
235
-
236
-
237
-
238
-
239
-
240
-
241
-
242
-
243
-
244
-
245
-
246
-
247
-
248
-
249
-
250
-
251
-
252
-
253
-
254
-
255
-
256
-
257
-
258
-
259
-
260
-
261
-
262
-
263
-
264
-
265
-
266
-
267
-
268
 |
 |

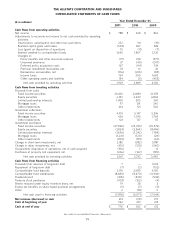
THE ALLSTATE CORPORATION AND SUBSIDIARIES
CONSOLIDATED STATEMENTS OF CASH FLOWS
Year Ended December 31,
($ in millions)
2011 2010 2009
Cash flows from operating activities
Net income $ 788 $ 928 $ 854
Adjustments to reconcile net income to net cash provided by operating
activities:
Depreciation, amortization and other non-cash items 252 94 (91)
Realized capital gains and losses (503) 827 583
Loss (gain) on disposition of operations 15 (11) (7)
Interest credited to contractholder funds 1,645 1,807 2,126
Changes in:
Policy benefits and other insurance reserves (77) 238 (577)
Unearned premiums 37 (40) (247)
Deferred policy acquisition costs 167 (94) 514
Premium installment receivables, net 33 10 26
Reinsurance recoverables, net (716) (265) (85)
Income taxes 134 200 1,660
Other operating assets and liabilities 154 (5) (455)
Net cash provided by operating activities 1,929 3,689 4,301
Cash flows from investing activities
Proceeds from sales
Fixed income securities 29,436 22,881 21,359
Equity securities 2,012 4,349 6,894
Limited partnership interests 1,000 505 369
Mortgage loans 97 124 340
Other investments 164 121 520
Investment collections
Fixed income securities 4,951 5,147 5,556
Mortgage loans 634 1,076 1,764
Other investments 123 137 117
Investment purchases
Fixed income securities (27,896) (25,745) (29,573)
Equity securities (1,824) (3,564) (8,496)
Limited partnership interests (1,696) (1,342) (784)
Mortgage loans (1,241) (120) (26)
Other investments (204) (181) (64)
Change in short-term investments, net 2,182 (382) 5,981
Change in other investments, net (415) (519) (340)
(Acquisition) disposition of operations, net of cash acquired (916) 7 12
Purchases of property and equipment, net (246) (162) (189)
Net cash provided by investing activities 6,161 2,332 3,440
Cash flows from financing activities
Proceeds from issuance of long-term debt 7 — 1,003
Repayment of long-term debt (7) (2) (752)
Contractholder fund deposits 2,176 2,980 4,150
Contractholder fund withdrawals (8,680) (8,470) (11,406)
Dividends paid (435) (430) (542)
Treasury stock purchases (953) (152) (4)
Shares reissued under equity incentive plans, net 19 28 3
Excess tax benefits on share-based payment arrangements (5) (7) (5)
Other 2 (18) 9
Net cash used in financing activities (7,876) (6,071) (7,544)
Net increase (decrease) in cash 214 (50) 197
Cash at beginning of year 562 612 415
Cash at end of year $ 776 $ 562 $ 612
See notes to consolidated financial statements.
99