Allstate 2012 Annual Report Download - page 205
Download and view the complete annual report
Please find page 205 of the 2012 Allstate annual report below. You can navigate through the pages in the report by either clicking on the pages listed below, or by using the keyword search tool below to find specific information within the annual report.-
 1
1 -
2
-
3
-
4
-
5
-
6
-
7
-
8
-
9
-
10
-
11
-
12
-
13
-
14
-
15
-
16
-
17
-
18
-
19
-
20
-
21
-
22
-
23
-
24
-
25
-
26
-
27
-
28
-
29
-
30
-
31
-
32
-
33
-
34
-
35
-
36
-
37
-
38
-
39
-
40
-
41
-
42
-
43
-
44
-
45
-
46
-
47
-
48
-
49
-
50
-
51
-
52
-
53
-
54
-
55
-
56
-
57
-
58
-
59
-
60
-
61
-
62
-
63
-
64
-
65
-
66
-
67
-
68
-
69
-
70
-
71
-
72
-
73
-
74
-
75
-
76
-
77
-
78
-
79
-
80
-
81
-
82
-
83
-
84
-
85
-
86
-
87
-
88
-
89
-
90
-
91
-
92
-
93
-
94
-
95
-
96
-
97
-
98
-
99
-
100
-
101
-
102
-
103
-
104
-
105
-
106
-
107
-
108
-
109
-
110
-
111
-
112
-
113
-
114
-
115
-
116
-
117
-
118
-
119
-
120
-
121
-
122
-
123
-
124
-
125
-
126
-
127
-
128
-
129
-
130
-
131
-
132
-
133
-
134
-
135
-
136
-
137
-
138
-
139
-
140
-
141
-
142
-
143
-
144
-
145
-
146
-
147
-
148
-
149
-
150
-
151
-
152
-
153
-
154
-
155
-
156
-
157
-
158
-
159
-
160
-
161
-
162
-
163
-
164
-
165
-
166
-
167
-
168
-
169
-
170
-
171
-
172
-
173
-
174
-
175
-
176
-
177
-
178
-
179
-
180
-
181
-
182
-
183
-
184
-
185
-
186
-
187
-
188
-
189
-
190
-
191
-
192
-
193
-
194
-
 195
195 -
 196
196 -
 197
197 -
 198
198 -
 199
199 -
 200
200 -
 201
201 -
 202
202 -
 203
203 -
 204
204 -
 205
205 -
 206
206 -
 207
207 -
 208
208 -
 209
209 -
 210
210 -
 211
211 -
 212
212 -
 213
213 -
 214
214 -
 215
215 -
216
-
217
-
218
-
219
-
220
-
221
-
222
-
223
-
224
-
225
-
226
-
227
-
228
-
229
-
230
-
231
-
232
-
233
-
234
-
235
-
236
-
237
-
238
-
239
-
240
-
241
-
242
-
243
-
244
-
245
-
246
-
247
-
248
-
249
-
250
-
251
-
252
-
253
-
254
-
255
-
256
-
257
-
258
-
259
-
260
-
261
-
262
-
263
-
264
-
265
-
266
-
267
-
268
 |
 |

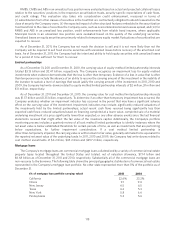
The types of properties collateralizing the mortgage loans as of December 31 are as follows:
(% of mortgage loan portfolio carrying value) 2011 2010
Office buildings 27.9% 32.1%
Retail 24.8 27.3
Apartment complex 19.6 12.8
Warehouse 19.4 21.9
Other 8.3 5.9
Total 100.0% 100.0%
The contractual maturities of the mortgage loan portfolio as of December 31, 2011, excluding $43 million of
mortgage loans in the process of foreclosure, are as follows:
($ in millions) Number of Carrying
loans value Percent
2012 59 $ 580 8.2%
2013 59 473 6.6
2014 70 935 13.2
2015 64 942 13.3
Thereafter 377 4,166 58.7
Total 629 $ 7,096 100.0%
Mortgage loans are evaluated for impairment on a specific loan basis through a quarterly credit monitoring process
and review of key credit quality indicators. Mortgage loans are considered impaired when it is probable that the
Company will not collect the contractual principal and interest. Valuation allowances are established for impaired loans
to reduce the carrying value to the fair value of the collateral less costs to sell or the present value of the loan’s expected
future repayment cash flows discounted at the loan’s original effective interest rate. Impaired mortgage loans may not
have a valuation allowance when the fair value of the collateral less costs to sell is higher than the carrying value.
Mortgage loan valuation allowances are charged off when there is no reasonable expectation of recovery. The
impairment evaluation is non-statistical in respect to the aggregate portfolio but considers facts and circumstances
attributable to each loan. It is not considered probable that additional impairment losses, beyond those identified on a
specific loan basis, have been incurred as of December 31, 2011.
Accrual of income is suspended for mortgage loans that are in default or when full and timely collection of principal
and interest payments is not probable. Cash receipts on mortgage loans on nonaccrual status are generally recorded as
a reduction of carrying value.
Debt service coverage ratio is considered a key credit quality indicator when mortgage loans are evaluated for
impairment. Debt service coverage ratio represents the amount of estimated cash flows from the property available to
the borrower to meet principal and interest payment obligations. Debt service coverage ratio estimates are updated
annually or more frequently if conditions are warranted based on the Company’s credit monitoring process.
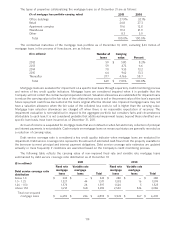
The following table reflects the carrying value of non-impaired fixed rate and variable rate mortgage loans
summarized by debt service coverage ratio distribution as of December 31:
2011 2010
($ in millions)
Fixed rate Variable rate Fixed rate Variable rate
mortgage mortgage mortgage mortgage
Debt service coverage ratio loans loans Total loans loans Total
distribution
Below 1.0 $ 345 $ — $ 345 $ 280 $ — $ 280
1.0 - 1.25 1,527 44 1,571 1,583 16 1,599
1.26 - 1.50 1,573 24 1,597 1,520 5 1,525
Above 1.50 3,214 168 3,382 2,540 546 3,086
Total non-impaired
mortgage loans $ 6,659 $ 236 $ 6,895 $ 5,923 $ 567 $ 6,490
119