Allstate 2012 Annual Report Download - page 154
Download and view the complete annual report
Please find page 154 of the 2012 Allstate annual report below. You can navigate through the pages in the report by either clicking on the pages listed below, or by using the keyword search tool below to find specific information within the annual report.-
 1
1 -
2
-
3
-
4
-
5
-
6
-
7
-
8
-
9
-
10
-
11
-
12
-
13
-
14
-
15
-
16
-
17
-
18
-
19
-
20
-
21
-
22
-
23
-
24
-
25
-
26
-
27
-
28
-
29
-
30
-
31
-
32
-
33
-
34
-
35
-
36
-
37
-
38
-
39
-
40
-
41
-
42
-
43
-
44
-
45
-
46
-
47
-
48
-
49
-
50
-
51
-
52
-
53
-
54
-
55
-
56
-
57
-
58
-
59
-
60
-
61
-
62
-
63
-
64
-
65
-
66
-
67
-
68
-
69
-
70
-
71
-
72
-
73
-
74
-
75
-
76
-
77
-
78
-
79
-
80
-
81
-
82
-
83
-
84
-
85
-
86
-
87
-
88
-
89
-
90
-
91
-
92
-
93
-
94
-
95
-
96
-
97
-
98
-
99
-
100
-
101
-
102
-
103
-
104
-
105
-
106
-
107
-
108
-
109
-
110
-
111
-
112
-
113
-
114
-
115
-
116
-
117
-
118
-
119
-
120
-
121
-
122
-
123
-
124
-
125
-
126
-
127
-
128
-
129
-
130
-
131
-
132
-
133
-
134
-
135
-
136
-
137
-
138
-
139
-
140
-
141
-
142
-
143
-
 144
144 -
 145
145 -
 146
146 -
 147
147 -
 148
148 -
 149
149 -
 150
150 -
 151
151 -
 152
152 -
 153
153 -
 154
154 -
 155
155 -
 156
156 -
 157
157 -
 158
158 -
 159
159 -
 160
160 -
 161
161 -
 162
162 -
 163
163 -
 164
164 -
165
-
166
-
167
-
168
-
169
-
170
-
171
-
172
-
173
-
174
-
175
-
176
-
177
-
178
-
179
-
180
-
181
-
182
-
183
-
184
-
185
-
186
-
187
-
188
-
189
-
190
-
191
-
192
-
193
-
194
-
195
-
196
-
197
-
198
-
199
-
200
-
201
-
202
-
203
-
204
-
205
-
206
-
207
-
208
-
209
-
210
-
211
-
212
-
213
-
214
-
215
-
216
-
217
-
218
-
219
-
220
-
221
-
222
-
223
-
224
-
225
-
226
-
227
-
228
-
229
-
230
-
231
-
232
-
233
-
234
-
235
-
236
-
237
-
238
-
239
-
240
-
241
-
242
-
243
-
244
-
245
-
246
-
247
-
248
-
249
-
250
-
251
-
252
-
253
-
254
-
255
-
256
-
257
-
258
-
259
-
260
-
261
-
262
-
263
-
264
-
265
-
266
-
267
-
268
 |
 |

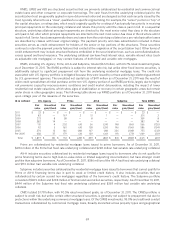
Municipal bonds, including tax exempt, taxable and ARS securities, totaled $14.24 billion as of December 31, 2011
with an unrealized net capital gain of $607 million. The municipal bond portfolio includes general obligations of state
and local issuers, revenue bonds and pre-refunded bonds, which are bonds for which an irrevocable trust has been
established to fund the remaining payments of principal and interest.
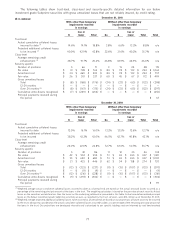
The following table summarizes by state the fair value, amortized cost and credit rating of our municipal bonds,
excluding $1.39 billion of pre-refunded bonds, as of December 31, 2011.
($ in millions) State Average
general Local general Amortized credit
State obligation obligation Revenue (1) Fair value cost rating
California $ 76 $ 626 $ 632 $ 1,334 $ 1,316 A
Texas 24 391 574 989 922 Aa
Florida 43 163 558 764 728 A
New York 33 108 535 676 637 Aa
Ohio 99 197 249 545 530 A
Illinois — 147 347 494 457 A
Missouri 30 131 286 447 429 A
Delaware — — 393 393 428 Aa
Pennsylvania 94 92 200 386 378 Aa
Michigan 33 137 211 381 365 Aa
All others 1,127 1,422 3,898 6,447 6,164 A
Total $ 1,559 $ 3,414 $ 7,883 $ 12,856 $ 12,354 A
(1) The nature of the activities supporting revenue bonds is highly diversified and includes transportation, health care, industrial
development, housing, higher education, utilities, recreation/convention centers and other activities.
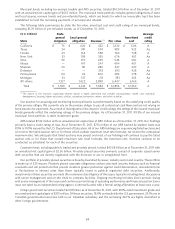
Our practice for acquiring and monitoring municipal bonds is predominantly based on the underlying credit quality
of the primary obligor. We currently rely on the primary obligor to pay all contractual cash flows and are not relying on
bond insurers for payments. As a result of downgrades in the insurers’ credit ratings, the ratings of the insured municipal
bonds generally reflect the underlying ratings of the primary obligor. As of December 31, 2011, 99.3% of our insured
municipal bond portfolio is rated investment grade.
ARS totaled $742 million with an unrealized net capital loss of $80 million as of December 31, 2011. Our holdings
primarily have a credit rating of Aaa. As of December 31, 2011, $710 million of our ARS backed by student loans was
80% to 100% insured by the U.S. Department of Education. All of our ARS holdings are experiencing failed auctions and
we receive the failed auction rate or, for those which contain maximum reset rate formulas, we receive the contractual
maximum rate. We anticipate that failed auctions may persist and most of our holdings will continue to pay the failed
auction rate or, for those that contain maximum rate reset formulas, the maximum rate. Auctions continue to be
conducted as scheduled for each of the securities.
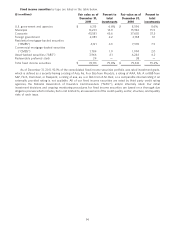
Corporate bonds, including publicly traded and privately placed, totaled $43.58 billion as of December 31, 2011 with
an unrealized net capital gain of $2.36 billion. Privately placed securities primarily consist of corporate issued senior
debt securities that are directly negotiated with the borrower or are in unregistered form.
Our portfolio of privately placed securities is broadly diversified by issuer, industry sector and country. The portfolio
is made up of 525 issuers. Privately placed corporate obligations contain structural security features such as financial
covenants and call protections that provide investors greater protection against credit deterioration, reinvestment risk
or fluctuations in interest rates than those typically found in publicly registered debt securities. Additionally,
investments in these securities are made after extensive due diligence of the issuer, typically including direct discussions
with senior management and on-site visits to company facilities. Ongoing monitoring includes direct periodic dialog
with senior management of the issuer and continuous monitoring of operating performance and financial position. Every
issue not rated by an independent rating agency is internally rated with a formal rating affirmation at least once a year.
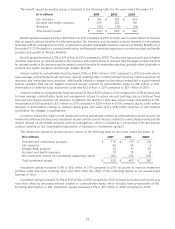
Foreign government securities totaled $2.08 billion as of December 31, 2011, with 100% rated investment grade and
an unrealized net capital gain of $215 million. Of these securities, 18.8% are backed by the U.S. government, 35.1% are in
Canadian governmental securities held in our Canadian subsidiary and the remaining 46.1% are highly diversified in
other foreign governments.
68