Allstate 2012 Annual Report Download - page 198
Download and view the complete annual report
Please find page 198 of the 2012 Allstate annual report below. You can navigate through the pages in the report by either clicking on the pages listed below, or by using the keyword search tool below to find specific information within the annual report.-
 1
1 -
2
-
3
-
4
-
5
-
6
-
7
-
8
-
9
-
10
-
11
-
12
-
13
-
14
-
15
-
16
-
17
-
18
-
19
-
20
-
21
-
22
-
23
-
24
-
25
-
26
-
27
-
28
-
29
-
30
-
31
-
32
-
33
-
34
-
35
-
36
-
37
-
38
-
39
-
40
-
41
-
42
-
43
-
44
-
45
-
46
-
47
-
48
-
49
-
50
-
51
-
52
-
53
-
54
-
55
-
56
-
57
-
58
-
59
-
60
-
61
-
62
-
63
-
64
-
65
-
66
-
67
-
68
-
69
-
70
-
71
-
72
-
73
-
74
-
75
-
76
-
77
-
78
-
79
-
80
-
81
-
82
-
83
-
84
-
85
-
86
-
87
-
88
-
89
-
90
-
91
-
92
-
93
-
94
-
95
-
96
-
97
-
98
-
99
-
100
-
101
-
102
-
103
-
104
-
105
-
106
-
107
-
108
-
109
-
110
-
111
-
112
-
113
-
114
-
115
-
116
-
117
-
118
-
119
-
120
-
121
-
122
-
123
-
124
-
125
-
126
-
127
-
128
-
129
-
130
-
131
-
132
-
133
-
134
-
135
-
136
-
137
-
138
-
139
-
140
-
141
-
142
-
143
-
144
-
145
-
146
-
147
-
148
-
149
-
150
-
151
-
152
-
153
-
154
-
155
-
156
-
157
-
158
-
159
-
160
-
161
-
162
-
163
-
164
-
165
-
166
-
167
-
168
-
169
-
170
-
171
-
172
-
173
-
174
-
175
-
176
-
177
-
178
-
179
-
180
-
181
-
182
-
183
-
184
-
185
-
186
-
187
-
 188
188 -
 189
189 -
 190
190 -
 191
191 -
 192
192 -
 193
193 -
 194
194 -
 195
195 -
 196
196 -
 197
197 -
 198
198 -
 199
199 -
 200
200 -
 201
201 -
 202
202 -
 203
203 -
 204
204 -
 205
205 -
 206
206 -
 207
207 -
 208
208 -
209
-
210
-
211
-
212
-
213
-
214
-
215
-
216
-
217
-
218
-
219
-
220
-
221
-
222
-
223
-
224
-
225
-
226
-
227
-
228
-
229
-
230
-
231
-
232
-
233
-
234
-
235
-
236
-
237
-
238
-
239
-
240
-
241
-
242
-
243
-
244
-
245
-
246
-
247
-
248
-
249
-
250
-
251
-
252
-
253
-
254
-
255
-
256
-
257
-
258
-
259
-
260
-
261
-
262
-
263
-
264
-
265
-
266
-
267
-
268
 |
 |

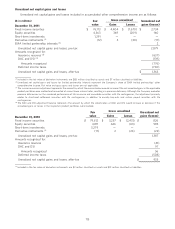
Gross unrealized
Amortized Fair($ in millions)
cost Gains Losses value
December 31, 2010
U.S. government and agencies $ 8,320 $ 327 $ (51) $ 8,596
Municipal 16,201 379 (646) 15,934
Corporate 36,260 1,816 (421) 37,655
Foreign government 2,821 347 (10) 3,158
RMBS 8,509 216 (732) 7,993
CMBS 2,213 58 (277) 1,994
ABS 4,425 113 (294) 4,244
Redeemable preferred stock 37 1 — 38
Total fixed income securities $ 78,786 $ 3,257 $ (2,431) $ 79,612
Scheduled maturities
The scheduled maturities for fixed income securities are as follows as of December 31, 2011:
($ in millions) Amortized Fair
cost value
Due in one year or less $ 3,243 $ 3,279
Due after one year through five years 21,377 22,153
Due after five years through ten years 21,718 23,247
Due after ten years 18,329 19,347
64,667 68,026
RMBS and ABS 8,712 8,087
Total $ 73,379 $ 76,113
Actual maturities may differ from those scheduled as a result of prepayments by the issuers. Because of the
potential for prepayment on RMBS and ABS, they are not categorized by contractual maturity. CMBS are categorized by
contractual maturity because they generally are not subject to prepayment risk.
Net investment income
Net investment income for the years ended December 31 is as follows:
($ in millions) 2011 2010 2009
Fixed income securities $ 3,484 $ 3,737 $ 3,998
Equity securities 122 90 80
Mortgage loans 359 385 498
Limited partnership interests 88 40 17
Short-term investments 6 8 27
Other 95 19 (10)
Investment income, before expense 4,154 4,279 4,610
Investment expense (183) (177) (166)
Net investment income $ 3,971 $ 4,102 $ 4,444
112