Allstate 2012 Annual Report Download - page 172
Download and view the complete annual report
Please find page 172 of the 2012 Allstate annual report below. You can navigate through the pages in the report by either clicking on the pages listed below, or by using the keyword search tool below to find specific information within the annual report.-
 1
1 -
2
-
3
-
4
-
5
-
6
-
7
-
8
-
9
-
10
-
11
-
12
-
13
-
14
-
15
-
16
-
17
-
18
-
19
-
20
-
21
-
22
-
23
-
24
-
25
-
26
-
27
-
28
-
29
-
30
-
31
-
32
-
33
-
34
-
35
-
36
-
37
-
38
-
39
-
40
-
41
-
42
-
43
-
44
-
45
-
46
-
47
-
48
-
49
-
50
-
51
-
52
-
53
-
54
-
55
-
56
-
57
-
58
-
59
-
60
-
61
-
62
-
63
-
64
-
65
-
66
-
67
-
68
-
69
-
70
-
71
-
72
-
73
-
74
-
75
-
76
-
77
-
78
-
79
-
80
-
81
-
82
-
83
-
84
-
85
-
86
-
87
-
88
-
89
-
90
-
91
-
92
-
93
-
94
-
95
-
96
-
97
-
98
-
99
-
100
-
101
-
102
-
103
-
104
-
105
-
106
-
107
-
108
-
109
-
110
-
111
-
112
-
113
-
114
-
115
-
116
-
117
-
118
-
119
-
120
-
121
-
122
-
123
-
124
-
125
-
126
-
127
-
128
-
129
-
130
-
131
-
132
-
133
-
134
-
135
-
136
-
137
-
138
-
139
-
140
-
141
-
142
-
143
-
144
-
145
-
146
-
147
-
148
-
149
-
150
-
151
-
152
-
153
-
154
-
155
-
156
-
157
-
158
-
159
-
160
-
161
-
 162
162 -
 163
163 -
 164
164 -
 165
165 -
 166
166 -
 167
167 -
 168
168 -
 169
169 -
 170
170 -
 171
171 -
 172
172 -
 173
173 -
 174
174 -
 175
175 -
 176
176 -
 177
177 -
 178
178 -
 179
179 -
 180
180 -
 181
181 -
 182
182 -
183
-
184
-
185
-
186
-
187
-
188
-
189
-
190
-
191
-
192
-
193
-
194
-
195
-
196
-
197
-
198
-
199
-
200
-
201
-
202
-
203
-
204
-
205
-
206
-
207
-
208
-
209
-
210
-
211
-
212
-
213
-
214
-
215
-
216
-
217
-
218
-
219
-
220
-
221
-
222
-
223
-
224
-
225
-
226
-
227
-
228
-
229
-
230
-
231
-
232
-
233
-
234
-
235
-
236
-
237
-
238
-
239
-
240
-
241
-
242
-
243
-
244
-
245
-
246
-
247
-
248
-
249
-
250
-
251
-
252
-
253
-
254
-
255
-
256
-
257
-
258
-
259
-
260
-
261
-
262
-
263
-
264
-
265
-
266
-
267
-
268
 |
 |
discounted cash flow calculations and peer company price to earnings multiples analysis. The analyses were weighted
based on management’s judgment of their relevance given current facts and circumstances.
The stock price and market capitalization analysis takes into consideration the quoted market price of our
outstanding common stock and includes a control premium, derived from historical insurance industry acquisition
activity, in determining the estimated fair value of the consolidated entity before allocating that fair value to individual
reporting units. The discounted cash flow analysis utilizes long term assumptions for revenue growth, capital growth,
earnings projections including those used in our strategic plan, and an appropriate discount rate. The peer company
price to earnings multiples analysis takes into consideration the price earnings multiples of peer companies for each
reporting unit and estimated income from our strategic plan. We apply significant judgment when determining the fair
value of our reporting units and when assessing the relationship of market capitalization to the estimated fair value of
our reporting units. The valuation analyses described above are subject to critical judgments and assumptions and may
be potentially sensitive to variability. Estimates of fair value are inherently uncertain and represent management’s
reasonable expectation regarding future developments. These estimates and the judgments and assumptions utilized
may differ from future actual results. Declines in the estimated fair value of our reporting units could result in goodwill
impairments in future periods which may be material to our results of operations but not our financial position.
Goodwill impairment evaluations indicated no impairment as of December 31, 2011 and no reporting unit was at risk
of having its carrying value including goodwill exceed its fair value.
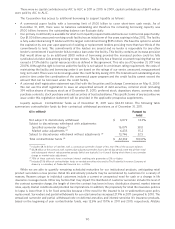
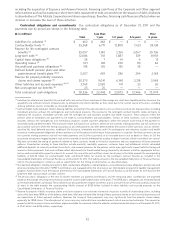
DEFERRED TAXES
As of December 31, 2011, we had a net deferred tax asset of $520 million. Included in the deferred tax asset was
$99 million, net of valuation allowance, for net operating loss carryforwards obtained in the acquisition of Esurance and
Answer Financial. The total deferred tax valuation allowance was $67 million as of December 31, 2011 compared to
$6 million as of December 31, 2010. The valuation allowance increased primarily due to the acquisition of Answer
Financial. The valuation allowance relates to the portion of Answer Financial’s net operating loss carryforwards that, due
to limitations contained in the Internal Revenue Code, are expected to expire prior to their utilization.
We evaluate whether a valuation allowance for our deferred tax assets is required each reporting period. A
valuation allowance is established if, based on the weight of available evidence, it is more likely than not that some
portion or all of the deferred income tax asset will not be realized. In determining whether a valuation allowance is
needed, all available evidence is considered. This includes the potential for capital and ordinary loss carryback, future
reversals of existing taxable temporary differences, tax planning strategies that we may employ to avoid a tax benefit
from expiring unused and future taxable income exclusive of reversing temporary differences.
With respect to our evaluation of the need for a valuation allowance related to the deferred tax asset on capital
losses that have been realized but have not yet been recognized for tax purposes, we utilize prudent and feasible tax
planning strategies that optimize the ability to carry back capital losses as well as the ability to offset future capital
losses with unrealized capital gains that could be recognized for tax purposes. We have remaining capital loss carryback
capacity of $266 million, $37 million and $329 million from 2009, 2010 and 2011, respectively.
With respect to our evaluation of the need for a valuation allowance related to the deferred tax asset on unrealized
capital losses on fixed income and equity securities, our tax planning strategies first consider the availability of
unrealized capital gains to offset future capital losses and then we rely on our assertion that we have the intent and
ability to hold certain securities with unrealized losses to recovery. As a result, the unrealized losses on these securities
would not be expected to materialize and no valuation allowance on the associated deferred tax asset is needed.
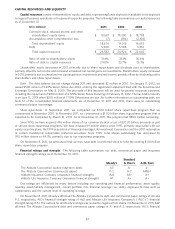
CAPITAL RESOURCES AND LIQUIDITY 2011 HIGHLIGHTS
• Shareholders’ equity as of December 31, 2011 was $18.67 billion, a decrease of 1.8% from $19.02 billion as of
December 31, 2010.
• On January 3, 2011, April 1, 2011, July 1, 2011 and October 3, 2011, we paid a quarterly shareholder dividend of $0.20,
$0.21, $0.21 and $0.21, respectively. On November 8, 2011, we declared a quarterly shareholder dividend of $0.21
payable on January 3, 2012. On February 21, 2012, we declared a quarterly shareholder dividend of $0.22 payable on
April 2, 2012.
• In September 2011, we completed our $1.00 billion share repurchase program that commenced in November 2010.
• In November 2011, we commenced a $1.00 billion share repurchase program that is expected to be completed by
March 31, 2013. As of December 31, 2011, this program had $894 million remaining.
86