Allstate 2012 Annual Report Download - page 145
Download and view the complete annual report
Please find page 145 of the 2012 Allstate annual report below. You can navigate through the pages in the report by either clicking on the pages listed below, or by using the keyword search tool below to find specific information within the annual report.-
 1
1 -
2
-
3
-
4
-
5
-
6
-
7
-
8
-
9
-
10
-
11
-
12
-
13
-
14
-
15
-
16
-
17
-
18
-
19
-
20
-
21
-
22
-
23
-
24
-
25
-
26
-
27
-
28
-
29
-
30
-
31
-
32
-
33
-
34
-
35
-
36
-
37
-
38
-
39
-
40
-
41
-
42
-
43
-
44
-
45
-
46
-
47
-
48
-
49
-
50
-
51
-
52
-
53
-
54
-
55
-
56
-
57
-
58
-
59
-
60
-
61
-
62
-
63
-
64
-
65
-
66
-
67
-
68
-
69
-
70
-
71
-
72
-
73
-
74
-
75
-
76
-
77
-
78
-
79
-
80
-
81
-
82
-
83
-
84
-
85
-
86
-
87
-
88
-
89
-
90
-
91
-
92
-
93
-
94
-
95
-
96
-
97
-
98
-
99
-
100
-
101
-
102
-
103
-
104
-
105
-
106
-
107
-
108
-
109
-
110
-
111
-
112
-
113
-
114
-
115
-
116
-
117
-
118
-
119
-
120
-
121
-
122
-
123
-
124
-
125
-
126
-
127
-
128
-
129
-
130
-
131
-
132
-
133
-
134
-
 135
135 -
 136
136 -
 137
137 -
 138
138 -
 139
139 -
 140
140 -
 141
141 -
 142
142 -
 143
143 -
 144
144 -
 145
145 -
 146
146 -
 147
147 -
 148
148 -
 149
149 -
 150
150 -
 151
151 -
 152
152 -
 153
153 -
 154
154 -
 155
155 -
156
-
157
-
158
-
159
-
160
-
161
-
162
-
163
-
164
-
165
-
166
-
167
-
168
-
169
-
170
-
171
-
172
-
173
-
174
-
175
-
176
-
177
-
178
-
179
-
180
-
181
-
182
-
183
-
184
-
185
-
186
-
187
-
188
-
189
-
190
-
191
-
192
-
193
-
194
-
195
-
196
-
197
-
198
-
199
-
200
-
201
-
202
-
203
-
204
-
205
-
206
-
207
-
208
-
209
-
210
-
211
-
212
-
213
-
214
-
215
-
216
-
217
-
218
-
219
-
220
-
221
-
222
-
223
-
224
-
225
-
226
-
227
-
228
-
229
-
230
-
231
-
232
-
233
-
234
-
235
-
236
-
237
-
238
-
239
-
240
-
241
-
242
-
243
-
244
-
245
-
246
-
247
-
248
-
249
-
250
-
251
-
252
-
253
-
254
-
255
-
256
-
257
-
258
-
259
-
260
-
261
-
262
-
263
-
264
-
265
-
266
-
267
-
268
 |
 |

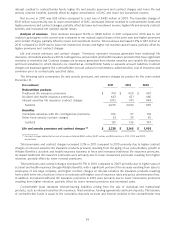
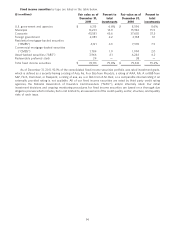
The benefit spread by product group is disclosed in the following table for the years ended December 31.
($ in millions) 2011 2010 2009
Life insurance $ 355 $ 282 $ 363
Accident and health insurance 329 252 196
Annuities (55) (25) (33)
Total benefit spread $ 629 $ 509 $ 526
Benefit spread increased 23.6% or $120 million in 2011 compared to 2010 primarily due to reestimations of reserves
that increased contract benefits for interest-sensitive life insurance and decreased contract benefits for immediate
annuities with life contingencies in 2010, a reduction in accident and health insurance reserves at Allstate Benefits as of
December 31, 2011 related to a contract modification, and favorable morbidity experience on certain accident and health
products and growth at Allstate Benefits.
Benefit spread decreased 3.2% or $17 million in 2010 compared to 2009. The decrease was primarily due to higher
mortality experience on interest-sensitive life insurance and reestimations of reserves that increased contract benefits
for interest-sensitive life insurance and decreased contract benefits for immediate annuities, partially offset by growth in
accident and health insurance sold through Allstate Benefits.
Interest credited to contractholder funds decreased 9.0% or $162 million in 2011 compared to 2010 primarily due to
lower average contractholder funds and lower interest crediting rates on deferred fixed annuities, interest-sensitive life
insurance and immediate fixed annuities. Additionally, valuation changes on derivatives embedded in equity-indexed
annuity contracts that are not hedged increased interest credited to contractholder funds by $18 million in 2011.
Amortization of deferred sales inducement costs was $23 million in 2011 compared to $27 million in 2010.
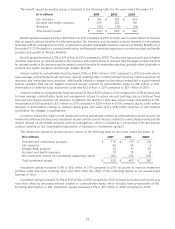
Interest credited to contractholder funds decreased 15.0% or $319 million in 2010 compared to 2009 primarily due
to lower average contractholder funds and management actions to reduce interest crediting rates on deferred fixed
annuities and interest-sensitive life insurance. In addition, the decline in 2010 also reflects lower amortization of DSI.
Amortization of DSI declined to $27 million in 2010 compared to $129 million in 2009, primarily due to a $46 million
decrease in amortization relating to realized capital gains and losses and a $38 million reduction in amortization
acceleration for changes in assumptions.
In order to analyze the impact of net investment income and interest credited to contractholders on net income, we
monitor the difference between net investment income and the sum of interest credited to contractholder funds and the
implied interest on immediate annuities with life contingencies, which is included as a component of life and annuity
contract benefits on the Consolidated Statements of Operations (‘‘investment spread’’).
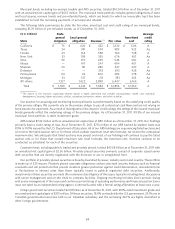
The investment spread by product group is shown in the following table for the years ended December 31.
($ in millions) 2011 2010 2009
Annuities and institutional products $ 170 $ 179 $ 126
Life insurance 54 35 3
Allstate Bank products 22 31 30
Accident and health insurance 19 18 16
Net investment income on investments supporting capital 265 234 205
Total investment spread $ 530 $ 497 $ 380
Investment spread increased 6.6% or $33 million in 2011 compared to 2010 as actions to improve investment
portfolio yields and lower crediting rates more than offset the effect of the continuing decline in our spread-based
business in force.
Investment spread increased 30.8% or $117 million in 2010 compared to 2009 as lower net investment income was
more than offset by decreased interest credited to contractholder funds, which includes lower amortization of DSI.
Excluding amortization of DSI, investment spread increased 2.9% or $15 million in 2010 compared to 2009.
59