Allstate 2012 Annual Report Download - page 259
Download and view the complete annual report
Please find page 259 of the 2012 Allstate annual report below. You can navigate through the pages in the report by either clicking on the pages listed below, or by using the keyword search tool below to find specific information within the annual report.-
 1
1 -
2
-
3
-
4
-
5
-
6
-
7
-
8
-
9
-
10
-
11
-
12
-
13
-
14
-
15
-
16
-
17
-
18
-
19
-
20
-
21
-
22
-
23
-
24
-
25
-
26
-
27
-
28
-
29
-
30
-
31
-
32
-
33
-
34
-
35
-
36
-
37
-
38
-
39
-
40
-
41
-
42
-
43
-
44
-
45
-
46
-
47
-
48
-
49
-
50
-
51
-
52
-
53
-
54
-
55
-
56
-
57
-
58
-
59
-
60
-
61
-
62
-
63
-
64
-
65
-
66
-
67
-
68
-
69
-
70
-
71
-
72
-
73
-
74
-
75
-
76
-
77
-
78
-
79
-
80
-
81
-
82
-
83
-
84
-
85
-
86
-
87
-
88
-
89
-
90
-
91
-
92
-
93
-
94
-
95
-
96
-
97
-
98
-
99
-
100
-
101
-
102
-
103
-
104
-
105
-
106
-
107
-
108
-
109
-
110
-
111
-
112
-
113
-
114
-
115
-
116
-
117
-
118
-
119
-
120
-
121
-
122
-
123
-
124
-
125
-
126
-
127
-
128
-
129
-
130
-
131
-
132
-
133
-
134
-
135
-
136
-
137
-
138
-
139
-
140
-
141
-
142
-
143
-
144
-
145
-
146
-
147
-
148
-
149
-
150
-
151
-
152
-
153
-
154
-
155
-
156
-
157
-
158
-
159
-
160
-
161
-
162
-
163
-
164
-
165
-
166
-
167
-
168
-
169
-
170
-
171
-
172
-
173
-
174
-
175
-
176
-
177
-
178
-
179
-
180
-
181
-
182
-
183
-
184
-
185
-
186
-
187
-
188
-
189
-
190
-
191
-
192
-
193
-
194
-
195
-
196
-
197
-
198
-
199
-
200
-
201
-
202
-
203
-
204
-
205
-
206
-
207
-
208
-
209
-
210
-
211
-
212
-
213
-
214
-
215
-
216
-
217
-
218
-
219
-
220
-
221
-
222
-
223
-
224
-
225
-
226
-
227
-
228
-
229
-
230
-
231
-
232
-
233
-
234
-
235
-
236
-
237
-
238
-
239
-
240
-
241
-
242
-
243
-
244
-
245
-
246
-
247
-
248
-
 249
249 -
 250
250 -
 251
251 -
 252
252 -
 253
253 -
 254
254 -
 255
255 -
 256
256 -
 257
257 -
 258
258 -
 259
259 -
 260
260 -
 261
261 -
 262
262 -
 263
263 -
 264
264 -
 265
265 -
 266
266 -
 267
267 -
 268
268
 |
 |

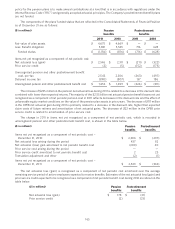
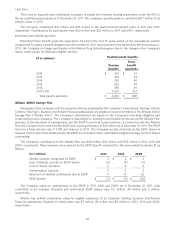
option is based on the U.S. Treasury yield curve in effect at the time of grant. The assumptions used are shown in the
following table.
2011 2010 2009
Weighted average expected term 7.9 years 7.8 years 8.1 years
Expected volatility 22.1 - 53.9% 23.7 - 52.3% 26.3 - 79.2%
Weighted average volatility 35.1% 35.1% 38.3%
Expected dividends 2.5 - 3.7% 2.4 - 2.8% 2.6%
Weighted average expected dividends 2.7% 2.6% 2.6%
Risk-free rate 0.0 - 3.5% 0.1 - 3.9% 0.0 - 3.7%
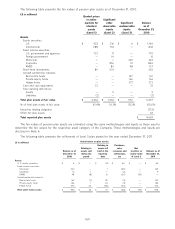
A summary of option activity for the year ended December 31, 2011 is shown in the following table.
Weighted
Weighted average
average Aggregate remaining
Number exercise intrinsic value contractual
(in 000s) price (in 000s) term (years)
Outstanding as of January 1, 2011 35,296 $ 39.39
Granted 4,177 31.57
Exercised (1,080) 17.87
Forfeited (1,230) 28.69
Expired (3,216) 44.69
Outstanding as of December 31, 2011: 33,947 39.00 $ 71,171 5.1
Outstanding, net of expected forfeitures 33,645 39.08 70,686 5.0
Outstanding, exercisable (‘‘vested’’) 21,417 45.26 28,243 3.5
The weighted average grant date fair value of options granted was $9.49, $9.89 and $5.74 during 2011, 2010 and
2009, respectively. The intrinsic value, which is the difference between the fair value and the exercise price, of options
exercised was $15 million, $16 million and $428 thousand during 2011, 2010 and 2009, respectively.
The changes in restricted stock units are shown in the following table for the year ended December 31, 2011.
Weighted
average
Number grant date
(in 000s) fair value
Nonvested as of January 1, 2011 3,757 $ 31.50
Granted 1,366 31.38
Vested (417) 61.66
Forfeited (380) 29.08
Nonvested as of December 31, 2011 4,326 28.76
The fair value of restricted stock units is based on the market value of the Company’s stock as of the date of the
grant. The market value in part reflects the payment of future dividends expected. The weighted average grant date fair
value of restricted stock units granted was $31.38, $31.32 and $17.47 during 2011, 2010 and 2009, respectively. The
total fair value of restricted stock units vested was $13 million, $16 million and $11 million during 2011, 2010 and 2009,
respectively.
The tax benefit realized in 2011, 2010 and 2009 related to tax deductions from stock option exercises and included
in shareholders’ equity was $3 million, $4 million and zero, respectively. The tax (expense) benefit realized in 2011, 2010
and 2009 related to all stock-based compensation and recorded directly to shareholders’ equity was $(0.4) million,
$0.5 million and $(6) million, respectively.
173