Allstate 2012 Annual Report Download - page 121
Download and view the complete annual report
Please find page 121 of the 2012 Allstate annual report below. You can navigate through the pages in the report by either clicking on the pages listed below, or by using the keyword search tool below to find specific information within the annual report.-
 1
1 -
2
-
3
-
4
-
5
-
6
-
7
-
8
-
9
-
10
-
11
-
12
-
13
-
14
-
15
-
16
-
17
-
18
-
19
-
20
-
21
-
22
-
23
-
24
-
25
-
26
-
27
-
28
-
29
-
30
-
31
-
32
-
33
-
34
-
35
-
36
-
37
-
38
-
39
-
40
-
41
-
42
-
43
-
44
-
45
-
46
-
47
-
48
-
49
-
50
-
51
-
52
-
53
-
54
-
55
-
56
-
57
-
58
-
59
-
60
-
61
-
62
-
63
-
64
-
65
-
66
-
67
-
68
-
69
-
70
-
71
-
72
-
73
-
74
-
75
-
76
-
77
-
78
-
79
-
80
-
81
-
82
-
83
-
84
-
85
-
86
-
87
-
88
-
89
-
90
-
91
-
92
-
93
-
94
-
95
-
96
-
97
-
98
-
99
-
100
-
101
-
102
-
103
-
104
-
105
-
106
-
107
-
108
-
109
-
110
-
 111
111 -
 112
112 -
 113
113 -
 114
114 -
 115
115 -
 116
116 -
 117
117 -
 118
118 -
 119
119 -
 120
120 -
 121
121 -
 122
122 -
 123
123 -
 124
124 -
 125
125 -
 126
126 -
 127
127 -
 128
128 -
 129
129 -
 130
130 -
 131
131 -
132
-
133
-
134
-
135
-
136
-
137
-
138
-
139
-
140
-
141
-
142
-
143
-
144
-
145
-
146
-
147
-
148
-
149
-
150
-
151
-
152
-
153
-
154
-
155
-
156
-
157
-
158
-
159
-
160
-
161
-
162
-
163
-
164
-
165
-
166
-
167
-
168
-
169
-
170
-
171
-
172
-
173
-
174
-
175
-
176
-
177
-
178
-
179
-
180
-
181
-
182
-
183
-
184
-
185
-
186
-
187
-
188
-
189
-
190
-
191
-
192
-
193
-
194
-
195
-
196
-
197
-
198
-
199
-
200
-
201
-
202
-
203
-
204
-
205
-
206
-
207
-
208
-
209
-
210
-
211
-
212
-
213
-
214
-
215
-
216
-
217
-
218
-
219
-
220
-
221
-
222
-
223
-
224
-
225
-
226
-
227
-
228
-
229
-
230
-
231
-
232
-
233
-
234
-
235
-
236
-
237
-
238
-
239
-
240
-
241
-
242
-
243
-
244
-
245
-
246
-
247
-
248
-
249
-
250
-
251
-
252
-
253
-
254
-
255
-
256
-
257
-
258
-
259
-
260
-
261
-
262
-
263
-
264
-
265
-
266
-
267
-
268
 |
 |

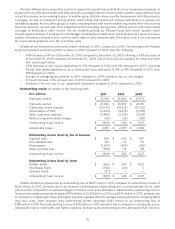
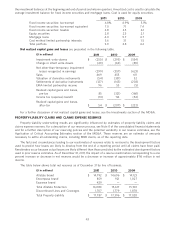
Allstate brand non-standard auto premiums written totaled $775 million in 2011, a decrease of 12.2% from
$883 million in 2010, following a 4.7% decrease in 2010 from $927 million in 2009. Contributing to the Allstate brand
non-standard auto premiums written decrease in 2011 compared to 2010 were the following:
– decrease in PIF as of December 31, 2011 compared to December 31, 2010, due to a decline in the number of
policies available to renew, a lower retention rate and fewer new issued applications
– 17.2% decrease in new issued applications to 256 thousand in 2011 from 309 thousand in 2010, driven in large
part by management actions in Florida through October 2011
– decrease in average gross premium in 2011 compared to 2010
– 1.0 point decrease in the renewal ratio in 2011 compared to 2010
Allstate brand non-standard auto premiums written decreased in 2010 compared to 2009. Contributing to the
Allstate brand non-standard auto premiums written decrease in 2010 compared to 2009 were the following:
– decrease in PIF as of December 31, 2010 compared to December 31, 2009, due to a decline in the number of
policies available to renew and fewer new issued applications
– 14.9% decrease in new issued applications to 309 thousand in 2010 from 363 thousand in 2009
– increase in average gross premium in 2010 compared to 2009
– 1.1 point decrease in the renewal ratio in 2010 compared to 2009
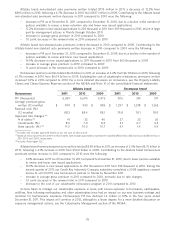
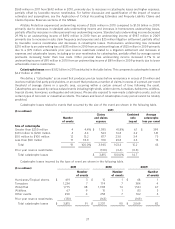
Homeowners premiums written totaled $6.26 billion in 2011, an increase of 2.4% from $6.11 billion in 2010, following
a 1.1% increase in 2010 from $6.04 billion in 2009. Excluding the cost of catastrophe reinsurance, premiums written
increased 1.6% in 2011 compared to 2010. For a more detailed discussion on reinsurance, see the Property-Liability
Claims and Claims Expense Reserves section of the MD&A and Note 10 of the consolidated financial statements.
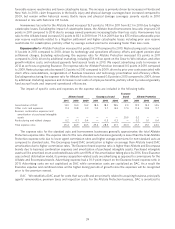
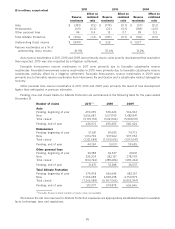
Allstate brand Encompass brand
Homeowners 2011 2010 2009 2011 2010 2009
PIF (thousands) 6,369 6,690 6,973 306 314 371
Average premium-gross
written (12 months) $ 999 $ 943 $ 883 $ 1,297 $ 1,298 $ 1,265
Renewal ratio (%)
(12 months) 88.3 88.4 88.1 79.8 78.1 78.9
Approved rate changes (1):
# of states (3) 41 32 40 27 23 36
Countrywide (%) 8.6 7.0 8.4 3.1 0.7 4.4
State specific (%) (2) 11.0 10.0 10.7 4.1 1.4 5.9
(1) Includes rate changes approved based on our net cost of reinsurance.
(2) Based on historical premiums written in those states, rate changes approved for homeowners totaled $533 million, $424 million and $534 million in
2011, 2010 and 2009, respectively.
(3) Includes Washington D.C.
Allstate brand homeowners premiums written totaled $5.89 billion in 2011, an increase of 2.4% from $5.75 billion in
2010, following a 2.1% increase in 2010 from $5.64 billion in 2009. Contributing to the Allstate brand homeowners
premiums written increase in 2011 compared to 2010 were the following:
– 4.8% decrease in PIF as of December 31, 2011 compared to December 31, 2010, due to fewer policies available
to renew and fewer new issued applications
– 14.9% decrease in new issued applications to 456 thousand in 2011 from 536 thousand in 2010. During the
second quarter of 2011, our Castle Key Indemnity Company subsidiary completed a 2008 regulatory consent
decree to sell 50,000 new homeowners policies in Florida by November 2011.
– increase in average gross premium in 2011 compared to 2010, primarily due to rate changes
– 0.1 point decrease in the renewal ratio in 2011 compared to 2010
– decrease in the cost of our catastrophe reinsurance program in 2011 compared to 2010
Actions taken to manage our catastrophe exposure in areas with known exposure to hurricanes, earthquakes,
wildfires, fires following earthquakes and other catastrophes have had an impact on our new business writings and
retention for homeowners insurance. Homeowners PIF has declined 1.2 million or 16% in the four years ended
December 31, 2011. This impact will continue in 2012, although to a lesser degree. For a more detailed discussion on
exposure management actions, see the Catastrophe Management section of the MD&A.
35