Allstate 2012 Annual Report Download - page 129
Download and view the complete annual report
Please find page 129 of the 2012 Allstate annual report below. You can navigate through the pages in the report by either clicking on the pages listed below, or by using the keyword search tool below to find specific information within the annual report.-
 1
1 -
2
-
3
-
4
-
5
-
6
-
7
-
8
-
9
-
10
-
11
-
12
-
13
-
14
-
15
-
16
-
17
-
18
-
19
-
20
-
21
-
22
-
23
-
24
-
25
-
26
-
27
-
28
-
29
-
30
-
31
-
32
-
33
-
34
-
35
-
36
-
37
-
38
-
39
-
40
-
41
-
42
-
43
-
44
-
45
-
46
-
47
-
48
-
49
-
50
-
51
-
52
-
53
-
54
-
55
-
56
-
57
-
58
-
59
-
60
-
61
-
62
-
63
-
64
-
65
-
66
-
67
-
68
-
69
-
70
-
71
-
72
-
73
-
74
-
75
-
76
-
77
-
78
-
79
-
80
-
81
-
82
-
83
-
84
-
85
-
86
-
87
-
88
-
89
-
90
-
91
-
92
-
93
-
94
-
95
-
96
-
97
-
98
-
99
-
100
-
101
-
102
-
103
-
104
-
105
-
106
-
107
-
108
-
109
-
110
-
111
-
112
-
113
-
114
-
115
-
116
-
117
-
118
-
 119
119 -
 120
120 -
 121
121 -
 122
122 -
 123
123 -
 124
124 -
 125
125 -
 126
126 -
 127
127 -
 128
128 -
 129
129 -
 130
130 -
 131
131 -
 132
132 -
 133
133 -
 134
134 -
 135
135 -
 136
136 -
 137
137 -
 138
138 -
 139
139 -
140
-
141
-
142
-
143
-
144
-
145
-
146
-
147
-
148
-
149
-
150
-
151
-
152
-
153
-
154
-
155
-
156
-
157
-
158
-
159
-
160
-
161
-
162
-
163
-
164
-
165
-
166
-
167
-
168
-
169
-
170
-
171
-
172
-
173
-
174
-
175
-
176
-
177
-
178
-
179
-
180
-
181
-
182
-
183
-
184
-
185
-
186
-
187
-
188
-
189
-
190
-
191
-
192
-
193
-
194
-
195
-
196
-
197
-
198
-
199
-
200
-
201
-
202
-
203
-
204
-
205
-
206
-
207
-
208
-
209
-
210
-
211
-
212
-
213
-
214
-
215
-
216
-
217
-
218
-
219
-
220
-
221
-
222
-
223
-
224
-
225
-
226
-
227
-
228
-
229
-
230
-
231
-
232
-
233
-
234
-
235
-
236
-
237
-
238
-
239
-
240
-
241
-
242
-
243
-
244
-
245
-
246
-
247
-
248
-
249
-
250
-
251
-
252
-
253
-
254
-
255
-
256
-
257
-
258
-
259
-
260
-
261
-
262
-
263
-
264
-
265
-
266
-
267
-
268
 |
 |

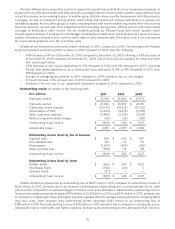
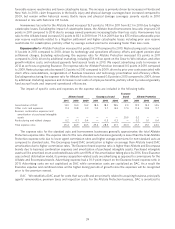
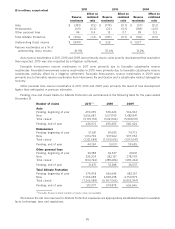
the investment balances at the beginning and end of period and interim quarters. Amortized cost is used to calculate the
average investment balance for fixed income securities and mortgage loans. Cost is used for equity securities.
2011 2010 2009
Fixed income securities: tax-exempt 4.8% 4.9% 5.1%
Fixed income securities: tax-exempt equivalent 7.0 7.1 7.4
Fixed income securities: taxable 3.8 3.5 4.1
Equity securities 2.8 2.3 2.1
Mortgage loans 4.0 5.7 4.7
Cost method limited partnership interests 5.6 3.1 1.5
Total portfolio 3.9 3.8 4.2
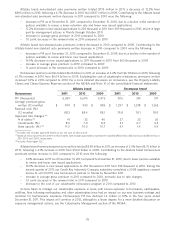
Net realized capital gains and losses are presented in the following table.
($ in millions) 2011 2010 2009
Impairment write-downs $ (250) $ (295) $ (534)
Change in intent write-downs (49) (62) (89)
Net other-than-temporary impairment
losses recognized in earnings (299) (357) (623)
Sales 469 455 611
Valuation of derivative instruments (54) (331) 52
Settlements of derivative instruments (127) (143) (203)
EMA limited partnership income 96 55 (5)
Realized capital gains and losses,
pre-tax 85 (321) (168)
Income tax (expense) benefit (31) 114 (54)
Realized capital gains and losses,
after-tax $ 54 $ (207) $ (222)
For a further discussion of net realized capital gains and losses, see the Investments section of the MD&A.
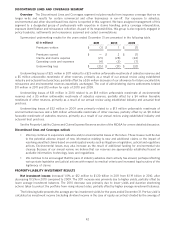
PROPERTY-LIABILITY CLAIMS AND CLAIMS EXPENSE RESERVES
Property-Liability underwriting results are significantly influenced by estimates of property-liability claims and
claims expense reserves. For a description of our reserve process, see Note 8 of the consolidated financial statements
and for a further description of our reserving policies and the potential variability in our reserve estimates, see the
Application of Critical Accounting Estimates section of the MD&A. These reserves are an estimate of amounts
necessary to settle all outstanding claims, including IBNR claims, as of the reporting date.
The facts and circumstances leading to our reestimates of reserves relate to revisions to the development factors
used to predict how losses are likely to develop from the end of a reporting period until all claims have been paid.
Reestimates occur because actual losses are likely different than those predicted by the estimated development factors
used in prior reserve estimates. As of December 31, 2011, the impact of a reserve reestimation corresponding to a one
percent increase or decrease in net reserves would be a decrease or increase of approximately $116 million in net
income.
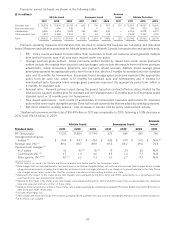
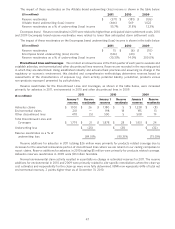
The table below shows total net reserves as of December 31 by line of business.
($ in millions) 2011 2010 2009
Allstate brand $ 14,792 $ 14,696 $ 14,123
Encompass brand 859 921 1,027
Esurance brand 429 — —
Total Allstate Protection 16,080 15,617 15,150
Discontinued Lines and Coverages 1,707 1,779 1,878
Total Property-Liability $ 17,787 $ 17,396 $ 17,028
43