Allstate 2012 Annual Report Download - page 233
Download and view the complete annual report
Please find page 233 of the 2012 Allstate annual report below. You can navigate through the pages in the report by either clicking on the pages listed below, or by using the keyword search tool below to find specific information within the annual report.-
 1
1 -
2
-
3
-
4
-
5
-
6
-
7
-
8
-
9
-
10
-
11
-
12
-
13
-
14
-
15
-
16
-
17
-
18
-
19
-
20
-
21
-
22
-
23
-
24
-
25
-
26
-
27
-
28
-
29
-
30
-
31
-
32
-
33
-
34
-
35
-
36
-
37
-
38
-
39
-
40
-
41
-
42
-
43
-
44
-
45
-
46
-
47
-
48
-
49
-
50
-
51
-
52
-
53
-
54
-
55
-
56
-
57
-
58
-
59
-
60
-
61
-
62
-
63
-
64
-
65
-
66
-
67
-
68
-
69
-
70
-
71
-
72
-
73
-
74
-
75
-
76
-
77
-
78
-
79
-
80
-
81
-
82
-
83
-
84
-
85
-
86
-
87
-
88
-
89
-
90
-
91
-
92
-
93
-
94
-
95
-
96
-
97
-
98
-
99
-
100
-
101
-
102
-
103
-
104
-
105
-
106
-
107
-
108
-
109
-
110
-
111
-
112
-
113
-
114
-
115
-
116
-
117
-
118
-
119
-
120
-
121
-
122
-
123
-
124
-
125
-
126
-
127
-
128
-
129
-
130
-
131
-
132
-
133
-
134
-
135
-
136
-
137
-
138
-
139
-
140
-
141
-
142
-
143
-
144
-
145
-
146
-
147
-
148
-
149
-
150
-
151
-
152
-
153
-
154
-
155
-
156
-
157
-
158
-
159
-
160
-
161
-
162
-
163
-
164
-
165
-
166
-
167
-
168
-
169
-
170
-
171
-
172
-
173
-
174
-
175
-
176
-
177
-
178
-
179
-
180
-
181
-
182
-
183
-
184
-
185
-
186
-
187
-
188
-
189
-
190
-
191
-
192
-
193
-
194
-
195
-
196
-
197
-
198
-
199
-
200
-
201
-
202
-
203
-
204
-
205
-
206
-
207
-
208
-
209
-
210
-
211
-
212
-
213
-
214
-
215
-
216
-
217
-
218
-
219
-
220
-
221
-
222
-
 223
223 -
 224
224 -
 225
225 -
 226
226 -
 227
227 -
 228
228 -
 229
229 -
 230
230 -
 231
231 -
 232
232 -
 233
233 -
 234
234 -
 235
235 -
 236
236 -
 237
237 -
 238
238 -
 239
239 -
 240
240 -
 241
241 -
 242
242 -
 243
243 -
244
-
245
-
246
-
247
-
248
-
249
-
250
-
251
-
252
-
253
-
254
-
255
-
256
-
257
-
258
-
259
-
260
-
261
-
262
-
263
-
264
-
265
-
266
-
267
-
268
 |
 |

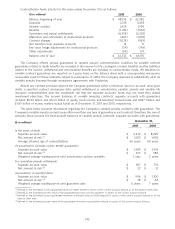
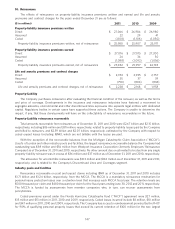
10. Reinsurance
The effects of reinsurance on property-liability insurance premiums written and earned and life and annuity
premiums and contract charges for the years ended December 31 are as follows:
($ in millions) 2011 2010 2009
Property-liability insurance premiums written
Direct $ 27,066 $ 26,984 $ 26,980
Assumed 22 29 41
Ceded (1,108) (1,106) (1,050)
Property-liability insurance premiums written, net of reinsurance $ 25,980 $ 25,907 $ 25,971
Property-liability insurance premiums earned
Direct $ 27,016 $ 27,015 $ 27,200
Assumed 24 34 50
Ceded (1,098) (1,092) (1,056)
Property-liability insurance premiums earned, net of reinsurance $ 25,942 $ 25,957 $ 26,194
Life and annuity premiums and contract charges
Direct $ 2,953 $ 2,935 $ 2,757
Assumed 35 37 39
Ceded (750) (804) (838)
Life and annuity premiums and contract charges, net of reinsurance $ 2,238 $ 2,168 $ 1,958
Property-Liability
The Company purchases reinsurance after evaluating the financial condition of the reinsurer, as well as the terms
and price of coverage. Developments in the insurance and reinsurance industries have fostered a movement to
segregate asbestos, environmental and other discontinued lines exposures into separate legal entities with dedicated
capital. Regulatory bodies in certain cases have supported these actions. The Company is unable to determine the
impact, if any, that these developments will have on the collectability of reinsurance recoverables in the future.
Property-Liability reinsurance recoverable
Total amounts recoverable from reinsurers as of December 31, 2011 and 2010 were $2.67 billion and $2.15 billion,
respectively, including $86 million and $81 million, respectively, related to property-liability losses paid by the Company
and billed to reinsurers, and $2.59 billion and $2.07 billion, respectively, estimated by the Company with respect to
ceded unpaid losses (including IBNR), which are not billable until the losses are paid.
With the exception of the recoverable balances from the Michigan Catastrophic Claim Association (‘‘MCCA’’),
Lloyd’s of London and other industry pools and facilities, the largest reinsurance recoverable balance the Company had
outstanding was $98 million and $56 million from Westport Insurance Corporation (formerly Employers’ Reinsurance
Company) as of December 31, 2011 and 2010, respectively. No other amount due or estimated to be due from any single
property-liability reinsurer was in excess of $36 million and $37 million as of December 31, 2011 and 2010, respectively.
The allowance for uncollectible reinsurance was $103 million and $142 million as of December 31, 2011 and 2010,
respectively, and is related to the Company’s Discontinued Lines and Coverages segment.
Industry pools and facilities
Reinsurance recoverable on paid and unpaid claims including IBNR as of December 31, 2011 and 2010 includes
$1.71 billion and $1.24 billion, respectively, from the MCCA. The MCCA is a mandatory reinsurance mechanism for
personal injury protection losses over a retention level that increases each MCCA fiscal year. The retention levels are
$500 thousand per claim and $480 thousand per claim for the fiscal years ending June 30, 2012 and 2011, respectively.
The MCCA is funded by assessments from member companies who, in turn, can recover assessments from
policyholders.
Ceded premiums earned under the Florida Hurricane Catastrophe Fund (‘‘FHCF’’) agreement were $27 million,
$15 million and $13 million in 2011, 2010 and 2009, respectively. Ceded losses incurred include $8 million, $10 million
and $47 million in 2011, 2010 and 2009, respectively. The Company has access to reimbursement provided by the FHCF
for 90% of qualifying personal property losses that exceed its current retention of $100 million for the two largest
147