Allstate 2012 Annual Report Download - page 100
Download and view the complete annual report
Please find page 100 of the 2012 Allstate annual report below. You can navigate through the pages in the report by either clicking on the pages listed below, or by using the keyword search tool below to find specific information within the annual report.-
 1
1 -
2
-
3
-
4
-
5
-
6
-
7
-
8
-
9
-
10
-
11
-
12
-
13
-
14
-
15
-
16
-
17
-
18
-
19
-
20
-
21
-
22
-
23
-
24
-
25
-
26
-
27
-
28
-
29
-
30
-
31
-
32
-
33
-
34
-
35
-
36
-
37
-
38
-
39
-
40
-
41
-
42
-
43
-
44
-
45
-
46
-
47
-
48
-
49
-
50
-
51
-
52
-
53
-
54
-
55
-
56
-
57
-
58
-
59
-
60
-
61
-
62
-
63
-
64
-
65
-
66
-
67
-
68
-
69
-
70
-
71
-
72
-
73
-
74
-
75
-
76
-
77
-
78
-
79
-
80
-
81
-
82
-
83
-
84
-
85
-
86
-
87
-
88
-
89
-
 90
90 -
 91
91 -
 92
92 -
 93
93 -
 94
94 -
 95
95 -
 96
96 -
 97
97 -
 98
98 -
 99
99 -
 100
100 -
 101
101 -
 102
102 -
 103
103 -
 104
104 -
 105
105 -
 106
106 -
 107
107 -
 108
108 -
 109
109 -
 110
110 -
111
-
112
-
113
-
114
-
115
-
116
-
117
-
118
-
119
-
120
-
121
-
122
-
123
-
124
-
125
-
126
-
127
-
128
-
129
-
130
-
131
-
132
-
133
-
134
-
135
-
136
-
137
-
138
-
139
-
140
-
141
-
142
-
143
-
144
-
145
-
146
-
147
-
148
-
149
-
150
-
151
-
152
-
153
-
154
-
155
-
156
-
157
-
158
-
159
-
160
-
161
-
162
-
163
-
164
-
165
-
166
-
167
-
168
-
169
-
170
-
171
-
172
-
173
-
174
-
175
-
176
-
177
-
178
-
179
-
180
-
181
-
182
-
183
-
184
-
185
-
186
-
187
-
188
-
189
-
190
-
191
-
192
-
193
-
194
-
195
-
196
-
197
-
198
-
199
-
200
-
201
-
202
-
203
-
204
-
205
-
206
-
207
-
208
-
209
-
210
-
211
-
212
-
213
-
214
-
215
-
216
-
217
-
218
-
219
-
220
-
221
-
222
-
223
-
224
-
225
-
226
-
227
-
228
-
229
-
230
-
231
-
232
-
233
-
234
-
235
-
236
-
237
-
238
-
239
-
240
-
241
-
242
-
243
-
244
-
245
-
246
-
247
-
248
-
249
-
250
-
251
-
252
-
253
-
254
-
255
-
256
-
257
-
258
-
259
-
260
-
261
-
262
-
263
-
264
-
265
-
266
-
267
-
268
 |
 |
APPLICATION OF CRITICAL ACCOUNTING ESTIMATES
The preparation of financial statements in conformity with accounting principles generally accepted in the United
States of America (‘‘GAAP’’) requires management to adopt accounting policies and make estimates and assumptions
that affect amounts reported in the consolidated financial statements. The most critical estimates include those used in
determining:
• Fair value of financial assets
• Impairment of fixed income and equity securities
• Deferred policy acquisition costs amortization
• Reserve for property-liability insurance claims and claims expense estimation
• Reserve for life-contingent contract benefits estimation
In making these determinations, management makes subjective and complex judgments that frequently require
estimates about matters that are inherently uncertain. Many of these policies, estimates and related judgments are
common in the insurance and financial services industries; others are specific to our businesses and operations. It is
reasonably likely that changes in these estimates could occur from period to period and result in a material impact on
our consolidated financial statements.
A brief summary of each of these critical accounting estimates follows. For a more detailed discussion of the effect
of these estimates on our consolidated financial statements, and the judgments and assumptions related to these
estimates, see the referenced sections of this document. For a complete summary of our significant accounting policies,
see the notes to the consolidated financial statements.
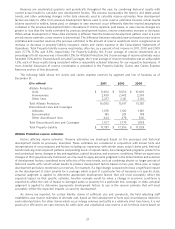
Fair value of financial assets Fair value is defined as the price that would be received to sell an asset or paid to
transfer a liability in an orderly transaction between market participants at the measurement date. We categorize our
financial assets measured at fair value into a three-level hierarchy based on the observability of inputs to the valuation
techniques as follows:
Level 1: Financial asset values are based on unadjusted quoted prices for identical assets in an active market that
we can access.
Level 2: Financial asset values are based on the following:
(a) Quoted prices for similar assets in active markets;
(b) Quoted prices for identical or similar assets in markets that are not active; or
(c) Valuation models whose inputs are observable, directly or indirectly, for substantially the full term of the
asset.
Level 3: Financial asset values are based on prices or valuation techniques that require inputs that are both
unobservable and significant to the overall fair value measurement. Unobservable inputs reflect our
estimates of the assumptions that market participants would use in valuing the financial assets.
Observable inputs are inputs that reflect the assumptions market participants would use in valuing financial assets
that are developed based on market data obtained from independent sources. In the absence of sufficient observable
inputs, unobservable inputs reflect our estimates of the assumptions market participants would use in valuing financial
assets and are developed based on the best information available in the circumstances. The degree of management
judgment involved in determining fair values is inversely related to the availability of market observable information.
We are responsible for the determination of fair value of financial assets and the supporting assumptions and
methodologies. We gain assurance on the overall reasonableness and consistent application of valuation input
assumptions, valuation methodologies and compliance with accounting standards for fair value determination through
the execution of various processes and controls designed to ensure that our financial assets are appropriately valued.
We monitor fair values received from third parties and those derived internally on an ongoing basis.
We employ independent third-party valuation service providers, broker quotes and internal pricing methods to
determine fair values. We obtain or calculate only one single quote or price for each financial instrument.
Valuation service providers typically obtain data about market transactions and other key valuation model inputs
from multiple sources and, through the use of proprietary models, produce valuation information in the form of a single
fair value for individual securities for which a fair value has been requested under the terms of our agreements. For
certain equity securities, valuation service providers provide market quotations for completed transactions on the
measurement date. For other security types, fair values are derived from the valuation service providers’ proprietary
valuation models. The inputs used by the valuation service providers include, but are not limited to, market prices from
recently completed transactions and transactions of comparable securities, interest rate yield curves, credit spreads,
14