Allstate 2012 Annual Report Download - page 147
Download and view the complete annual report
Please find page 147 of the 2012 Allstate annual report below. You can navigate through the pages in the report by either clicking on the pages listed below, or by using the keyword search tool below to find specific information within the annual report.-
 1
1 -
2
-
3
-
4
-
5
-
6
-
7
-
8
-
9
-
10
-
11
-
12
-
13
-
14
-
15
-
16
-
17
-
18
-
19
-
20
-
21
-
22
-
23
-
24
-
25
-
26
-
27
-
28
-
29
-
30
-
31
-
32
-
33
-
34
-
35
-
36
-
37
-
38
-
39
-
40
-
41
-
42
-
43
-
44
-
45
-
46
-
47
-
48
-
49
-
50
-
51
-
52
-
53
-
54
-
55
-
56
-
57
-
58
-
59
-
60
-
61
-
62
-
63
-
64
-
65
-
66
-
67
-
68
-
69
-
70
-
71
-
72
-
73
-
74
-
75
-
76
-
77
-
78
-
79
-
80
-
81
-
82
-
83
-
84
-
85
-
86
-
87
-
88
-
89
-
90
-
91
-
92
-
93
-
94
-
95
-
96
-
97
-
98
-
99
-
100
-
101
-
102
-
103
-
104
-
105
-
106
-
107
-
108
-
109
-
110
-
111
-
112
-
113
-
114
-
115
-
116
-
117
-
118
-
119
-
120
-
121
-
122
-
123
-
124
-
125
-
126
-
127
-
128
-
129
-
130
-
131
-
132
-
133
-
134
-
135
-
136
-
 137
137 -
 138
138 -
 139
139 -
 140
140 -
 141
141 -
 142
142 -
 143
143 -
 144
144 -
 145
145 -
 146
146 -
 147
147 -
 148
148 -
 149
149 -
 150
150 -
 151
151 -
 152
152 -
 153
153 -
 154
154 -
 155
155 -
 156
156 -
 157
157 -
158
-
159
-
160
-
161
-
162
-
163
-
164
-
165
-
166
-
167
-
168
-
169
-
170
-
171
-
172
-
173
-
174
-
175
-
176
-
177
-
178
-
179
-
180
-
181
-
182
-
183
-
184
-
185
-
186
-
187
-
188
-
189
-
190
-
191
-
192
-
193
-
194
-
195
-
196
-
197
-
198
-
199
-
200
-
201
-
202
-
203
-
204
-
205
-
206
-
207
-
208
-
209
-
210
-
211
-
212
-
213
-
214
-
215
-
216
-
217
-
218
-
219
-
220
-
221
-
222
-
223
-
224
-
225
-
226
-
227
-
228
-
229
-
230
-
231
-
232
-
233
-
234
-
235
-
236
-
237
-
238
-
239
-
240
-
241
-
242
-
243
-
244
-
245
-
246
-
247
-
248
-
249
-
250
-
251
-
252
-
253
-
254
-
255
-
256
-
257
-
258
-
259
-
260
-
261
-
262
-
263
-
264
-
265
-
266
-
267
-
268
 |
 |

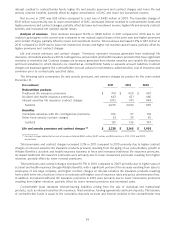
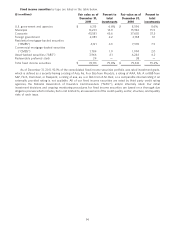
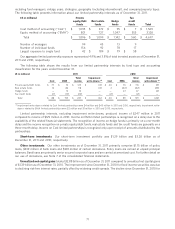
Amortization of DAC increased 66.6% or $237 million in 2011 compared to 2010 and decreased 63.1% or
$609 million in 2010 compared to 2009. The components of amortization of DAC are summarized in the following table
for the years ended December 31.
($ in millions) 2011 2010 2009
Amortization of DAC before amortization relating
to realized capital gains and losses, valuation
changes on embedded derivatives that are not
hedged and changes in assumptions $ 397 $ 326 $ 472
Amortization relating to realized capital gains and
losses (1) and valuation changes on embedded
derivatives that are not hedged 184 42 216
Amortization acceleration (deceleration) for
changes in assumptions (‘‘DAC unlocking’’) 12 (12) 277
Total amortization of DAC $ 593 $ 356 $ 965
(1) The impact of realized capital gains and losses on amortization of DAC is dependent upon the relationship between
the assets that give rise to the gain or loss and the product liability supported by the assets. Fluctuations result from
changes in the impact of realized capital gains and losses on actual and expected gross profits.
The increase of $237 million in 2011 was primarily due to increased amortization relating to realized capital gains,
lower amortization in the second quarter of 2010 resulting from decreased benefit spread on interest-sensitive life
insurance due to the reestimation of reserves, and an unfavorable change in amortization acceleration/deceleration for
changes in assumptions. In 2011, DAC amortization relating to realized capital gains and losses primarily resulted from
realized capital gains on sales of fixed income securities.
The decrease of $609 million in 2010 was primarily due to a favorable change in amortization acceleration/
deceleration for changes in assumptions, lower amortization relating to realized capital gains and losses, a decreased
amortization rate on fixed annuities and lower amortization from decreased benefit spread on interest-sensitive life
insurance due to the reestimation of reserves. In 2010, DAC amortization relating to realized capital gains and losses
primarily resulted from realized capital gains on derivatives and sales of fixed income securities.
During the first quarter of 2011, we completed our annual comprehensive review of the profitability of our products
to determine DAC balances for our interest-sensitive life, fixed annuities and other investment contracts which covers
assumptions for investment returns, including capital gains and losses, interest crediting rates to policyholders, the
effect of any hedges, persistency, mortality and expenses in all product lines. The review resulted in an acceleration of
DAC amortization (charge to income) of $12 million in the first quarter of 2011. Amortization acceleration of $17 million
related to interest-sensitive life insurance and was primarily due to an increase in projected expenses. Amortization
deceleration of $5 million related to equity-indexed annuities and was primarily due to an increase in projected
investment margins.
In 2010, our annual comprehensive review resulted in a deceleration of DAC amortization (credit to income) of
$12 million. Amortization deceleration of $45 million related to variable life insurance and was primarily due to
appreciation in the underlying separate account valuations. Amortization acceleration of $32 million related to interest-
sensitive life insurance and was primarily due to an increase in projected realized capital losses and lower projected
renewal premium (which is also expected to reduce persistency), partially offset by lower expenses.
In 2009, our annual comprehensive review resulted in the acceleration of DAC amortization of $277 million.
$289 million related to fixed annuities, of which $210 million was attributable to market value adjusted annuities, and
$18 million related to variable life insurance. Partially offsetting these amounts was amortization deceleration for
interest-sensitive life insurance of $30 million. The principal assumption impacting fixed annuity amortization
acceleration was an increase in the level of expected realized capital losses in 2009 and 2010. For interest-sensitive life
insurance, the amortization deceleration was due to a favorable change in our mortality assumptions, partially offset by
increased expected capital losses.
61