Allstate 2012 Annual Report Download - page 179
Download and view the complete annual report
Please find page 179 of the 2012 Allstate annual report below. You can navigate through the pages in the report by either clicking on the pages listed below, or by using the keyword search tool below to find specific information within the annual report.-
 1
1 -
2
-
3
-
4
-
5
-
6
-
7
-
8
-
9
-
10
-
11
-
12
-
13
-
14
-
15
-
16
-
17
-
18
-
19
-
20
-
21
-
22
-
23
-
24
-
25
-
26
-
27
-
28
-
29
-
30
-
31
-
32
-
33
-
34
-
35
-
36
-
37
-
38
-
39
-
40
-
41
-
42
-
43
-
44
-
45
-
46
-
47
-
48
-
49
-
50
-
51
-
52
-
53
-
54
-
55
-
56
-
57
-
58
-
59
-
60
-
61
-
62
-
63
-
64
-
65
-
66
-
67
-
68
-
69
-
70
-
71
-
72
-
73
-
74
-
75
-
76
-
77
-
78
-
79
-
80
-
81
-
82
-
83
-
84
-
85
-
86
-
87
-
88
-
89
-
90
-
91
-
92
-
93
-
94
-
95
-
96
-
97
-
98
-
99
-
100
-
101
-
102
-
103
-
104
-
105
-
106
-
107
-
108
-
109
-
110
-
111
-
112
-
113
-
114
-
115
-
116
-
117
-
118
-
119
-
120
-
121
-
122
-
123
-
124
-
125
-
126
-
127
-
128
-
129
-
130
-
131
-
132
-
133
-
134
-
135
-
136
-
137
-
138
-
139
-
140
-
141
-
142
-
143
-
144
-
145
-
146
-
147
-
148
-
149
-
150
-
151
-
152
-
153
-
154
-
155
-
156
-
157
-
158
-
159
-
160
-
161
-
162
-
163
-
164
-
165
-
166
-
167
-
168
-
 169
169 -
 170
170 -
 171
171 -
 172
172 -
 173
173 -
 174
174 -
 175
175 -
 176
176 -
 177
177 -
 178
178 -
 179
179 -
 180
180 -
 181
181 -
 182
182 -
 183
183 -
 184
184 -
 185
185 -
 186
186 -
 187
187 -
 188
188 -
 189
189 -
190
-
191
-
192
-
193
-
194
-
195
-
196
-
197
-
198
-
199
-
200
-
201
-
202
-
203
-
204
-
205
-
206
-
207
-
208
-
209
-
210
-
211
-
212
-
213
-
214
-
215
-
216
-
217
-
218
-
219
-
220
-
221
-
222
-
223
-
224
-
225
-
226
-
227
-
228
-
229
-
230
-
231
-
232
-
233
-
234
-
235
-
236
-
237
-
238
-
239
-
240
-
241
-
242
-
243
-
244
-
245
-
246
-
247
-
248
-
249
-
250
-
251
-
252
-
253
-
254
-
255
-
256
-
257
-
258
-
259
-
260
-
261
-
262
-
263
-
264
-
265
-
266
-
267
-
268
 |
 |

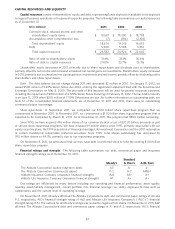
(6) Other liabilities primarily include accrued expenses and certain benefit obligations and claim payments and other checks outstanding. Certain of
these long-term liabilities are discounted with respect to interest, as a result the sum of the cash outflows shown for all years in the table exceeds
the corresponding liability amount of $3.76 billion.
(7) Balance sheet liabilities not included in the table above include unearned and advance premiums of $10.81 billion and deferred tax liabilities of
$2.14 billion netted in the net deferred tax asset of $520 million. These items were excluded as they do not meet the definition of a contractual
liability as we are not contractually obligated to pay these amounts to third parties. Rather, they represent an accounting mechanism that allows us
to present our financial statements on an accrual basis. In addition, other liabilities of $273 million were not included in the table above because
they did not represent a contractual obligation or the amount and timing of their eventual payment was sufficiently uncertain.
(8) Net unrecognized tax benefits represent our potential future obligation to the taxing authority for a tax position that was not recognized in the
consolidated financial statements. We believe it is reasonably possible that the liability balance will be reduced by $25 million within the next twelve
months upon the resolution of an outstanding issue resulting from the 2005-2006 Internal Revenue Service examination. The resolution of this
obligation may be for an amount different than what we have accrued.
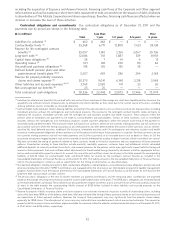
Our contractual commitments as of December 31, 2011 and the periods in which the commitments expire are shown
in the following table.
($ in millions) Less than Over
Total 1 year 1-3 years 4-5 years 5 years
Other commitments – conditional $ 193 $ 110 $ 7 $ 3 $ 73
Other commitments – unconditional 2,015 230 417 1,082 286
Total commitments $ 2,208 $ 340 $ 424 $ 1,085 $ 359
Contractual commitments represent investment commitments such as private placements, limited partnership
interests and other loans.
We have agreements in place for services we conduct, generally at cost, between subsidiaries relating to insurance,
reinsurance, loans and capitalization. All material intercompany transactions have appropriately been eliminated in
consolidation. Intercompany transactions among insurance subsidiaries and affiliates have been approved by the
appropriate departments of insurance as required.
For a more detailed discussion of our off-balance sheet arrangements, see Note 7 of the consolidated financial
statements.
ENTERPRISE RISK AND RETURN MANAGEMENT
Allstate manages enterprise risk under an integrated Enterprise Risk and Return Management (‘‘ERRM’’) framework
with governance and analytics. This framework provides an enterprise view of risks and opportunities and is used by
senior leaders and business managers to drive strategic and business decisions. Allstate’s risk management strategies
adapt to changes in business and market environments and seek to optimize returns. Allstate continually validates and
improves its ERRM practices by benchmarking and securing external perspectives for our processes.
ERRM governance includes an executive management committee structure, Board oversight and chief risk officers
(‘‘CROs’’). The Enterprise Risk & Return Council (‘‘ERRC’’) is Allstate’s senior risk management committee. It directs
ERRM by establishing risk-return targets, determining economic capital levels and directing integrated strategies and
actions from an enterprise perspective. It consists of Allstate’s chief executive officer, enterprise and business unit chief
risk officers and chief financial officers, general counsel and treasurer. Allstate’s Board of Directors and Audit
Committee provide ERRM oversight by reviewing enterprise principles, guidelines and limits for Allstate’s significant
risks and by monitoring strategies and actions management has taken to control these risks.
CROs are appointed for the enterprise and for Allstate Protection, Allstate Financial and Allstate Investments.
Collectively, the CROs create an integrated approach to risk and return management to ensure risk management
practices and strategies are aligned with Allstate’s overall enterprise objectives.
Our ERRM governance is supported with an analytic framework to manage risk exposure and optimize returns on
risk-adjusted capital. Allstate views economic capital primarily on a statutory accounting basis. Management and the
ERRC use enterprise stochastic modeling, risk expertise and judgment to determine an appropriate level of enterprise
economic capital to hold considering a broad range of risk objectives. These include limiting risks of financial stress,
insolvency, likelihood of capital stress and volatility, maintaining stakeholder value and financial strength ratings and
satisfying regulatory risk-based capital requirements. Enterprise economic capital approximates a combination of
statutory surplus and deployable invested assets at the parent holding company level.
93