Allstate 2012 Annual Report Download - page 137
Download and view the complete annual report
Please find page 137 of the 2012 Allstate annual report below. You can navigate through the pages in the report by either clicking on the pages listed below, or by using the keyword search tool below to find specific information within the annual report.-
 1
1 -
2
-
3
-
4
-
5
-
6
-
7
-
8
-
9
-
10
-
11
-
12
-
13
-
14
-
15
-
16
-
17
-
18
-
19
-
20
-
21
-
22
-
23
-
24
-
25
-
26
-
27
-
28
-
29
-
30
-
31
-
32
-
33
-
34
-
35
-
36
-
37
-
38
-
39
-
40
-
41
-
42
-
43
-
44
-
45
-
46
-
47
-
48
-
49
-
50
-
51
-
52
-
53
-
54
-
55
-
56
-
57
-
58
-
59
-
60
-
61
-
62
-
63
-
64
-
65
-
66
-
67
-
68
-
69
-
70
-
71
-
72
-
73
-
74
-
75
-
76
-
77
-
78
-
79
-
80
-
81
-
82
-
83
-
84
-
85
-
86
-
87
-
88
-
89
-
90
-
91
-
92
-
93
-
94
-
95
-
96
-
97
-
98
-
99
-
100
-
101
-
102
-
103
-
104
-
105
-
106
-
107
-
108
-
109
-
110
-
111
-
112
-
113
-
114
-
115
-
116
-
117
-
118
-
119
-
120
-
121
-
122
-
123
-
124
-
125
-
126
-
 127
127 -
 128
128 -
 129
129 -
 130
130 -
 131
131 -
 132
132 -
 133
133 -
 134
134 -
 135
135 -
 136
136 -
 137
137 -
 138
138 -
 139
139 -
 140
140 -
 141
141 -
 142
142 -
 143
143 -
 144
144 -
 145
145 -
 146
146 -
 147
147 -
148
-
149
-
150
-
151
-
152
-
153
-
154
-
155
-
156
-
157
-
158
-
159
-
160
-
161
-
162
-
163
-
164
-
165
-
166
-
167
-
168
-
169
-
170
-
171
-
172
-
173
-
174
-
175
-
176
-
177
-
178
-
179
-
180
-
181
-
182
-
183
-
184
-
185
-
186
-
187
-
188
-
189
-
190
-
191
-
192
-
193
-
194
-
195
-
196
-
197
-
198
-
199
-
200
-
201
-
202
-
203
-
204
-
205
-
206
-
207
-
208
-
209
-
210
-
211
-
212
-
213
-
214
-
215
-
216
-
217
-
218
-
219
-
220
-
221
-
222
-
223
-
224
-
225
-
226
-
227
-
228
-
229
-
230
-
231
-
232
-
233
-
234
-
235
-
236
-
237
-
238
-
239
-
240
-
241
-
242
-
243
-
244
-
245
-
246
-
247
-
248
-
249
-
250
-
251
-
252
-
253
-
254
-
255
-
256
-
257
-
258
-
259
-
260
-
261
-
262
-
263
-
264
-
265
-
266
-
267
-
268
 |
 |

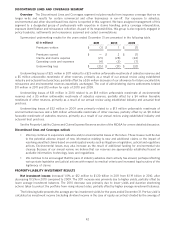
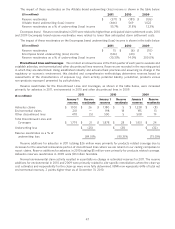
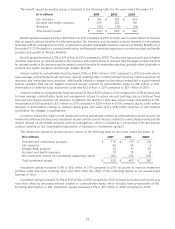
The largest reinsurance recoverable balances are shown in the following table as of December 31, net of the
allowance we have established for uncollectible amounts.
($ in millions) Standard
& Poor’s
financial Reinsurance
strength recoverable on paid
rating (1) and unpaid claims, net
2011 2010
Industry pools and facilities
Michigan Catastrophic Claim Association (‘‘MCCA’’) N/A $ 1,709 $ 1,243
North Carolina Reinsurance Facility N/A 70 65
New Jersey Unsatisfied Claim and Judgment Fund N/A 50 55
National Flood Insurance Program N/A 33 10
Other 346
Total 1,865 1,419
Asbestos, Environmental and Other
Lloyd’s of London (‘‘Lloyd’s’’) A+ 193 183
Westport Insurance Corporation (formerly Employers
Reinsurance Corporation) AA- 98 56
New England Reinsurance Corporation N/A 36 37
R&Q Reinsurance Company N/A 31 34
OneBeacon Insurance Company A- 30 1
Clearwater Insurance Company BB+ 27 30
Other, including allowance for future uncollectible reinsurance
recoverables 394 392
Total 809 733
Total Property-Liability $ 2,674 $ 2,152
(1) N/A reflects no rating available.
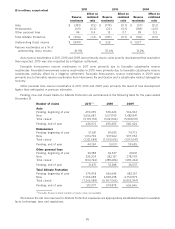
The effects of reinsurance ceded on our property-liability premiums earned and claims and claims expense for the
years ended December 31 are summarized in the following table.
($ in millions) 2011 2010 2009
Ceded property-liability premiums earned $ 1,098 $ 1,092 $ 1,056
Ceded property-liability claims and claims
expense
Industry pool and facilities
FHCF $ 8 $ 10 $ 47
National Flood Insurance Program 196 50 111
MCCA 509 142 133
Other 84 64 59
Subtotal industry pools and facilities 797 266 350
Asbestos, Environmental and Other 130 5 65
Ceded property-liability claims and claims
expense $ 927 $ 271 $ 415
For the year ended December 31, 2011, ceded property-liability premiums earned increased $6 million when
compared to prior year, primarily due to higher premium rates and an increase in policies written for the National Flood
Insurance Program. For the year ended December 31, 2010, ceded property-liability premiums earned increased
$36 million when compared to prior year, primarily due to the adoption of accounting guidance related to the
consolidation of variable interest entities, which resulted in the consolidation of two insurance company affiliates,
Allstate Texas Lloyds and Allstate County Mutual Insurance Company.
51