Allstate 2012 Annual Report Download - page 164
Download and view the complete annual report
Please find page 164 of the 2012 Allstate annual report below. You can navigate through the pages in the report by either clicking on the pages listed below, or by using the keyword search tool below to find specific information within the annual report.-
 1
1 -
2
-
3
-
4
-
5
-
6
-
7
-
8
-
9
-
10
-
11
-
12
-
13
-
14
-
15
-
16
-
17
-
18
-
19
-
20
-
21
-
22
-
23
-
24
-
25
-
26
-
27
-
28
-
29
-
30
-
31
-
32
-
33
-
34
-
35
-
36
-
37
-
38
-
39
-
40
-
41
-
42
-
43
-
44
-
45
-
46
-
47
-
48
-
49
-
50
-
51
-
52
-
53
-
54
-
55
-
56
-
57
-
58
-
59
-
60
-
61
-
62
-
63
-
64
-
65
-
66
-
67
-
68
-
69
-
70
-
71
-
72
-
73
-
74
-
75
-
76
-
77
-
78
-
79
-
80
-
81
-
82
-
83
-
84
-
85
-
86
-
87
-
88
-
89
-
90
-
91
-
92
-
93
-
94
-
95
-
96
-
97
-
98
-
99
-
100
-
101
-
102
-
103
-
104
-
105
-
106
-
107
-
108
-
109
-
110
-
111
-
112
-
113
-
114
-
115
-
116
-
117
-
118
-
119
-
120
-
121
-
122
-
123
-
124
-
125
-
126
-
127
-
128
-
129
-
130
-
131
-
132
-
133
-
134
-
135
-
136
-
137
-
138
-
139
-
140
-
141
-
142
-
143
-
144
-
145
-
146
-
147
-
148
-
149
-
150
-
151
-
152
-
153
-
 154
154 -
 155
155 -
 156
156 -
 157
157 -
 158
158 -
 159
159 -
 160
160 -
 161
161 -
 162
162 -
 163
163 -
 164
164 -
 165
165 -
 166
166 -
 167
167 -
 168
168 -
 169
169 -
 170
170 -
 171
171 -
 172
172 -
 173
173 -
 174
174 -
175
-
176
-
177
-
178
-
179
-
180
-
181
-
182
-
183
-
184
-
185
-
186
-
187
-
188
-
189
-
190
-
191
-
192
-
193
-
194
-
195
-
196
-
197
-
198
-
199
-
200
-
201
-
202
-
203
-
204
-
205
-
206
-
207
-
208
-
209
-
210
-
211
-
212
-
213
-
214
-
215
-
216
-
217
-
218
-
219
-
220
-
221
-
222
-
223
-
224
-
225
-
226
-
227
-
228
-
229
-
230
-
231
-
232
-
233
-
234
-
235
-
236
-
237
-
238
-
239
-
240
-
241
-
242
-
243
-
244
-
245
-
246
-
247
-
248
-
249
-
250
-
251
-
252
-
253
-
254
-
255
-
256
-
257
-
258
-
259
-
260
-
261
-
262
-
263
-
264
-
265
-
266
-
267
-
268
 |
 |
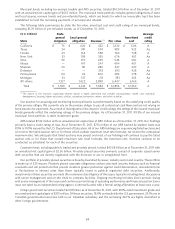
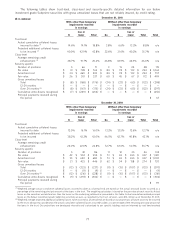
against credit opinions obtained from third parties, such as industry analysts, nationally recognized credit rating agencies and an RMBS loss
modeling advisory service. Projected additional collateral losses to be incurred are compared to average remaining credit enhancement for each
security. For securities where the projected additional collateral losses exceed remaining credit enhancement, a recovery value is calculated to
determine whether impairment losses should be recorded in earnings. The weighting calculation is based on the par value of each security.
(3) Weighted average remaining credit enhancement as of period end is based on structural subordination and the expected impact of other structural
features existing in the securitization trust beneficial to our class and reflects our projection of future principal losses that can occur as a percentage
of the remaining principal amount of the loans in the trust before the class of the security we own will incur its first dollar of principal loss. The
weighting calculation is based on the par value of each security.
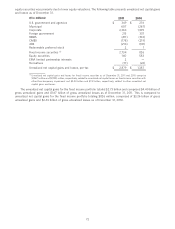
(4) As of December 31, 2011, $122 million of unrealized losses on securities with other-than-temporary impairments recognized in earnings and
$104 million of unrealized losses on securities without other-than-temporary impairments recognized in earnings have been greater than or equal
to 20% of those securities’ amortized cost for a period of more than 24 consecutive months. As of December 31, 2010, $188 million of unrealized
losses on securities with other-than-temporary impairments recognized in earnings and $108 million of unrealized losses on securities without
other-than-temporary impairments recognized in earnings have been greater than or equal to 20% of those securities’ amortized cost for a period
of more than 24 consecutive months.
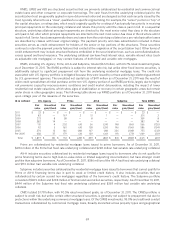
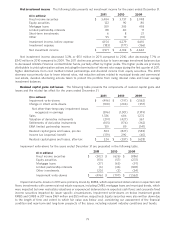
The above tables include information only about below investment grade Subprime securities with gross unrealized
losses that are not reliably insured as of each period presented. As such, the par value and composition of securities
included can vary significantly from period to period due to changes in variables such as credit ratings, principal
payments, sales, purchases and realized principal losses.
As of December 31, 2011, our Subprime securities that are reliably insured include nine below investment grade
Subprime securities with a total fair value of $87 million and aggregate gross unrealized losses of $36 million, all of
which are rated B. These securities are insured by one bond insurer rated B that we estimate has sufficient claims paying
capacity to service its obligations on these securities. The securitization trusts from which our securities were issued are
currently receiving contractual payments from the bond insurer and considering the combination of expected future
payments from the bond insurer and cash flows available from the underlying collateral, we expect the trust to have
adequate cash flows to make all contractual payments due to the class of securities we own. As a result, our security-
specific estimates of future cash flows indicate that these securities’ estimated recovery values equal or exceed their
amortized cost. Accordingly, no other-than-temporary impairments have been recognized on these securities. As of
December 31, 2010, our Subprime securities that are reliably insured included ten below investment grade Subprime
securities with a total fair value of $76 million and aggregate gross unrealized losses of $68 million.
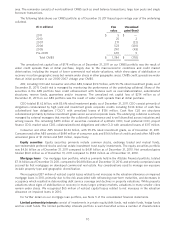
As of December 31, 2011, our below investment grade Subprime securities with gross unrealized losses that are not
reliably insured and without other-than-temporary impairments recorded in earnings had incurred actual cumulative
collateral losses of 8.8%. Our impairment evaluation forecasts more severe assumptions than the trusts are actually
experiencing, including a projected weighted average underlying default rate of 51.9% and a projected weighted average
loss severity of 69.5%, which resulted in projected additional collateral losses of 35.7%. As the average remaining credit
enhancement for these securities of 46.0% exceeds the projected additional collateral losses of 35.7%, these securities
have not been impaired.
As of December 31, 2011, our below investment grade Subprime securities with gross unrealized losses that are not
reliably insured and with other-than-temporary impairments recorded in earnings had incurred actual cumulative
collateral losses of 18.8%. Our impairment evaluation forecasts more severe assumptions than the trusts are actually
experiencing, including a projected weighted average underlying default rate of 56.8% and a projected weighted
average loss severity of 76.5%, which resulted in projected additional collateral losses of 42.8%. As the average
remaining credit enhancement for these securities of 20.2% is insufficient to withstand the projected additional
collateral losses, we have recognized cumulative write-downs in earnings on the securities as reflected in the table
above using our calculated recovery value at the time of impairment. The current average recovery value of these
securities as a percentage of par was 67.1% and exceeded these securities’ current average amortized cost as a
percentage of par of 65.4%, which demonstrates our conclusion that the nature of the remaining unrealized loss on
these securities is temporary and will reverse over time. The comparison indicates that recovery value exceeds
amortized cost based on a comprehensive evaluation of financial, economic and capital markets assumptions developed
for this reporting period.
We believe the unrealized losses on our Subprime securities, including those over 24 months, result from the
current risk premium on these securities, which should continue to reverse over the securities’ remaining lives, as
demonstrated by improved valuations since 2009, primarily in 2010. We expect to receive our estimated share of
contractual principal and interest collections used to determine the securities’ recovery value. As of December 31, 2011,
we do not have the intent to sell and it is not more likely than not we will be required to sell these securities before the
recovery of their amortized cost basis. We believe that our valuation and impairment processes are comprehensive,
employ the most current views about collateral and securitization trust financial positions, and demonstrate our
recorded impairments and that the remaining unrealized losses on these positions are temporary.
78