Allstate 2012 Annual Report Download - page 155
Download and view the complete annual report
Please find page 155 of the 2012 Allstate annual report below. You can navigate through the pages in the report by either clicking on the pages listed below, or by using the keyword search tool below to find specific information within the annual report.-
 1
1 -
2
-
3
-
4
-
5
-
6
-
7
-
8
-
9
-
10
-
11
-
12
-
13
-
14
-
15
-
16
-
17
-
18
-
19
-
20
-
21
-
22
-
23
-
24
-
25
-
26
-
27
-
28
-
29
-
30
-
31
-
32
-
33
-
34
-
35
-
36
-
37
-
38
-
39
-
40
-
41
-
42
-
43
-
44
-
45
-
46
-
47
-
48
-
49
-
50
-
51
-
52
-
53
-
54
-
55
-
56
-
57
-
58
-
59
-
60
-
61
-
62
-
63
-
64
-
65
-
66
-
67
-
68
-
69
-
70
-
71
-
72
-
73
-
74
-
75
-
76
-
77
-
78
-
79
-
80
-
81
-
82
-
83
-
84
-
85
-
86
-
87
-
88
-
89
-
90
-
91
-
92
-
93
-
94
-
95
-
96
-
97
-
98
-
99
-
100
-
101
-
102
-
103
-
104
-
105
-
106
-
107
-
108
-
109
-
110
-
111
-
112
-
113
-
114
-
115
-
116
-
117
-
118
-
119
-
120
-
121
-
122
-
123
-
124
-
125
-
126
-
127
-
128
-
129
-
130
-
131
-
132
-
133
-
134
-
135
-
136
-
137
-
138
-
139
-
140
-
141
-
142
-
143
-
144
-
 145
145 -
 146
146 -
 147
147 -
 148
148 -
 149
149 -
 150
150 -
 151
151 -
 152
152 -
 153
153 -
 154
154 -
 155
155 -
 156
156 -
 157
157 -
 158
158 -
 159
159 -
 160
160 -
 161
161 -
 162
162 -
 163
163 -
 164
164 -
 165
165 -
166
-
167
-
168
-
169
-
170
-
171
-
172
-
173
-
174
-
175
-
176
-
177
-
178
-
179
-
180
-
181
-
182
-
183
-
184
-
185
-
186
-
187
-
188
-
189
-
190
-
191
-
192
-
193
-
194
-
195
-
196
-
197
-
198
-
199
-
200
-
201
-
202
-
203
-
204
-
205
-
206
-
207
-
208
-
209
-
210
-
211
-
212
-
213
-
214
-
215
-
216
-
217
-
218
-
219
-
220
-
221
-
222
-
223
-
224
-
225
-
226
-
227
-
228
-
229
-
230
-
231
-
232
-
233
-
234
-
235
-
236
-
237
-
238
-
239
-
240
-
241
-
242
-
243
-
244
-
245
-
246
-
247
-
248
-
249
-
250
-
251
-
252
-
253
-
254
-
255
-
256
-
257
-
258
-
259
-
260
-
261
-
262
-
263
-
264
-
265
-
266
-
267
-
268
 |
 |

RMBS, CMBS and ABS are structured securities that are primarily collateralized by residential and commercial real
estate loans and other consumer or corporate borrowings. The cash flows from the underlying collateral paid to the
securitization trust are generally applied in a pre-determined order and are designed so that each security issued by the
trust, typically referred to as a ‘‘class’’, qualifies for a specific original rating. For example, the ‘‘senior’’ portion or ‘‘top’’ of
the capital structure, or rating class, which would originally qualify for a rating of Aaa typically has priority in receiving
principal repayments on the underlying collateral and retains this priority until the class is paid in full. In a sequential
structure, underlying collateral principal repayments are directed to the most senior rated Aaa class in the structure
until paid in full, after which principal repayments are directed to the next most senior Aaa class in the structure until it
is paid in full. Senior Aaa classes generally share any losses from the underlying collateral on a pro-rata basis after losses
are absorbed by classes with lower original ratings. The payment priority and class subordination included in these
securities serves as credit enhancement for holders of the senior or top portions of the structures. These securities
continue to retain the payment priority features that existed at the origination of the securitization trust. Other forms of
credit enhancement may include structural features embedded in the securitization trust, such as overcollateralization,
excess spread and bond insurance. The underlying collateral can have fixed interest rates, variable interest rates (such
as adjustable rate mortgages) or may contain features of both fixed and variable rate mortgages.
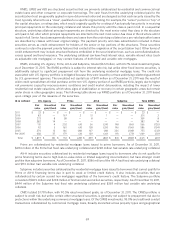
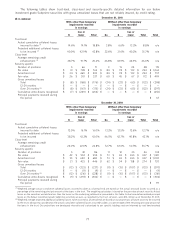
RMBS, including U.S. Agency, Prime, Alt-A and Subprime, totaled $4.12 billion, with 63.7% rated investment grade,
as of December 31, 2011. The RMBS portfolio is subject to interest rate risk, but unlike other fixed income securities, is
additionally subject to significant prepayment risk from the underlying residential mortgage loans. The credit risk
associated with U.S. Agency portfolio is mitigated because they were issued by or have underlying collateral guaranteed
by U.S. government agencies. The unrealized net capital loss of $411 million as of December 31, 2011 was the result of
wider credit spreads than at initial purchase on the non-U.S. Agency portion of our RMBS portfolio, largely due to higher
risk premiums caused by macroeconomic conditions and credit market deterioration, including the impact of lower
residential real estate valuations, which show signs of stabilization or recovery in certain geographic areas but remain
under stress in other geographic areas. The following table shows our RMBS portfolio as of December 31, 2011 based
upon vintage year of the issuance of the securities.
U.S. Agency Prime Alt-A Subprime Total RMBS($ in millions)
Fair Unrealized Fair Unrealized Fair Unrealized Fair Unrealized Fair Unrealized
value gain/(loss) value gain/(loss) value gain/(loss) value gain/(loss) value gain/(loss)
2011 $ 23 $ — $ — $ — $ — $ — $ — $ — $ 23 $ —
2010 83 — 167 2 51 1 — — 301 3
2009 273 8 58 — 8 — — — 339 8
2008 382 14 — — — — — — 382 14
2007 110 4 202 (4) 56 (24) 198 (96) 566 (120)
2006 92 5 160 (4) 138 (29) 196 (106) 586 (134)
2005 276 12 146 (18) 107 (18) 226 (108) 755 (132)
Pre-2005 658 37 179 (4) 139 (10) 193 (73) 1,169 (50)
Total $ 1,897 $ 80 $ 912 $ (28) $ 499 $ (80) $ 813 $ (383) $ 4,121 $ (411)
Prime are collateralized by residential mortgage loans issued to prime borrowers. As of December 31, 2011,
$684 million of the Prime had fixed rate underlying collateral and $228 million had variable rate underlying collateral.
Alt-A includes securities collateralized by residential mortgage loans issued to borrowers who do not qualify for
prime financing terms due to high loan-to-value ratios or limited supporting documentation, but have stronger credit
profiles than subprime borrowers. As of December 31, 2011, $386 million of the Alt-A had fixed rate underlying collateral
and $113 million had variable rate underlying collateral.
Subprime includes securities collateralized by residential mortgage loans issued to borrowers that cannot qualify for
Prime or Alt-A financing terms due in part to weak or limited credit history. It also includes securities that are
collateralized by certain second lien mortgages regardless of the borrower’s credit history. The Subprime portfolio
consisted of $605 million and $208 million of first lien and second lien securities, respectively. As of December 31, 2011,
$444 million of the Subprime had fixed rate underlying collateral and $369 million had variable rate underlying
collateral.
CMBS totaled $1.78 billion, with 90.5% rated investment grade, as of December 31, 2011. The CMBS portfolio is
subject to credit risk, but unlike certain other structured securities, is generally not subject to prepayment risk due to
protections within the underlying commercial mortgage loans. Of the CMBS investments, 93.0% are traditional conduit
transactions collateralized by commercial mortgage loans, broadly diversified across property types and geographical
69