Allstate 2011 Annual Report Download - page 65
Download and view the complete annual report
Please find page 65 of the 2011 Allstate annual report below. You can navigate through the pages in the report by either clicking on the pages listed below, or by using the keyword search tool below to find specific information within the annual report.-
 1
1 -
2
-
3
-
4
-
5
-
6
-
7
-
8
-
9
-
10
-
11
-
12
-
13
-
14
-
15
-
16
-
17
-
18
-
19
-
20
-
21
-
22
-
23
-
24
-
25
-
26
-
27
-
28
-
29
-
30
-
31
-
32
-
33
-
34
-
35
-
36
-
37
-
38
-
39
-
40
-
41
-
42
-
43
-
44
-
45
-
46
-
47
-
48
-
49
-
50
-
51
-
52
-
53
-
54
-
 55
55 -
 56
56 -
 57
57 -
 58
58 -
 59
59 -
 60
60 -
 61
61 -
 62
62 -
 63
63 -
 64
64 -
 65
65 -
 66
66 -
 67
67 -
 68
68 -
 69
69 -
 70
70 -
 71
71 -
 72
72 -
 73
73 -
 74
74 -
 75
75 -
76
-
77
-
78
-
79
-
80
-
81
-
82
-
83
-
84
-
85
-
86
-
87
-
88
-
89
-
90
-
91
-
92
-
93
-
94
-
95
-
96
-
97
-
98
-
99
-
100
-
101
-
102
-
103
-
104
-
105
-
106
-
107
-
108
-
109
-
110
-
111
-
112
-
113
-
114
-
115
-
116
-
117
-
118
-
119
-
120
-
121
-
122
-
123
-
124
-
125
-
126
-
127
-
128
-
129
-
130
-
131
-
132
-
133
-
134
-
135
-
136
-
137
-
138
-
139
-
140
-
141
-
142
-
143
-
144
-
145
-
146
-
147
-
148
-
149
-
150
-
151
-
152
-
153
-
154
-
155
-
156
-
157
-
158
-
159
-
160
-
161
-
162
-
163
-
164
-
165
-
166
-
167
-
168
-
169
-
170
-
171
-
172
-
173
-
174
-
175
-
176
-
177
-
178
-
179
-
180
-
181
-
182
-
183
-
184
-
185
-
186
-
187
-
188
-
189
-
190
-
191
-
192
-
193
-
194
-
195
-
196
-
197
-
198
-
199
-
200
-
201
-
202
-
203
-
204
-
205
-
206
-
207
-
208
-
209
-
210
-
211
-
212
-
213
-
214
-
215
-
216
-
217
-
218
-
219
-
220
-
221
-
222
-
223
-
224
-
225
-
226
-
227
-
228
-
229
-
230
-
231
-
232
-
233
-
234
-
235
-
236
-
237
-
238
-
239
-
240
-
241
-
242
-
243
-
244
-
245
-
246
-
247
-
248
-
249
-
250
-
251
-
252
-
253
-
254
-
255
-
256
-
257
-
258
-
259
-
260
-
261
-
262
-
263
-
264
-
265
-
266
-
267
-
268
-
269
-
270
-
271
-
272
-
273
-
274
-
275
-
276
 |
 |

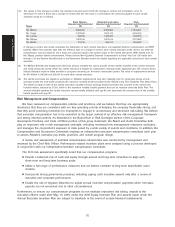
investment plan, in accordance with our investment policy. The specific measures and investments included are
listed below:
●Property Liability Portfolio Relative Total Return: Total return for Property-liability investments and Kennett
investments.
●Allstate Financial Portfolio Relative Total Return: Total return for Allstate Financial investments.
●Allstate Pension Plans Portfolio Relative Total Return: Total return for the Allstate Retirement Plan and Agents
Pension Plan investments.
Long-Term Cash Incentive Awards
Average Adjusted Return on Equity Relative to Peers: This measure is used to assess Allstate’s financial
performance against its peers. It is calculated as Allstate’s ranked position relative to the insurance company peer
group based upon three-year average adjusted return on equity, calculated on the same basis for Allstate and
each of the peer insurance companies. Three-year average adjusted return on equity is the sum of the annual
adjusted return on equity for each of the three years in the cycle divided by three. The annual adjusted return on
equity is calculated as the ratio of net income divided by the average of shareholders’ equity at the beginning and
at the end of the year after excluding the component of accumulated other comprehensive income for unrealized
net capital gains and losses.
Allstate Financial Return on Total Capital: This is a measure management uses to measure the efficiency of
capital utilized in the business. Three-year Allstate Financial return on total capital is the sum of the annual
adjusted return on subsidiaries’ shareholder’s equity for each of the three years divided by three. The annual
adjusted return on subsidiaries’ shareholder’s equity is the Allstate Financial measure, net income, divided by the
average subsidiaries’ shareholder’s equity at the beginning and at the end of the year. The subsidiaries’
shareholder’s equity is the sum of the subsidiaries’ shareholder’s equity for Allstate Life Insurance Company,
Allstate Bank, American Heritage Life Investment Corporation, and certain other minor entities, adjusted to
exclude the loan protection business and excluding the component of accumulated other comprehensive income
for unrealized net capital gains. (See note 18 to our audited financial statements for Allstate Financial net
income.)
Allstate Protection Growth in Policies in Force Over Three-Year Cycle: This is a measure used by
management to assess growth in the number of policies in force, which is a driver of premiums written. The
measure is calculated as the sum of the percent increase in each of the three years in the total number of
policies in force at the end of the year over the beginning of the year. The measure excludes property insurance,
Allstate Motor Club, and the loan protection business and includes Allstate Canada.
55
Proxy Statement