Allstate 2011 Annual Report Download - page 56
Download and view the complete annual report
Please find page 56 of the 2011 Allstate annual report below. You can navigate through the pages in the report by either clicking on the pages listed below, or by using the keyword search tool below to find specific information within the annual report.
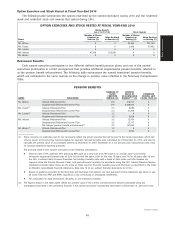
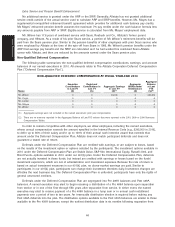
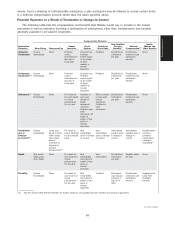
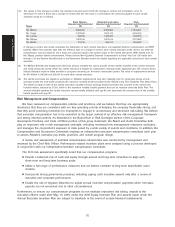
sum present value of the non-qualified pension benefits for each named executive earned through December 31, 2010, is shown in
the following table:
LUMP SUM
NAME PLAN NAME AMOUNT ($)
Mr. Wilson Supplemental Retirement Income Plan 6,093,640
Mr. Civgin Supplemental Retirement Income Plan 23,009
Mr. Lacher Supplemental Retirement Income Plan 4,375
Ms. Mayes Supplemental Retirement Income Plan 27,566
Ms. Mayes’ pension benefit enhancement 139,343
Mr. Winter Supplemental Retirement Income Plan 4,038
The amount shown is based on the lump sum methodology (i.e., interest rate and mortality table) used by the Allstate pension plans in
2011, as required under the Pension Protection Act. Specifically, the interest rate for 2011 is based on 20% of the average
August 30-year Treasury Bond rate from the prior year and 80% of the average corporate bond segmented yield curve from August of
the prior year. The mortality table for 2011 is the 2011 combined static Pension Protection Act funding mortality table with a blend of
50% males and 50% females, as required under the Internal Revenue Code.
(3) Messrs. Civgin, Lacher, and Winter are not currently vested in the Allstate Retirement Plan or the Supplemental Retirement Income Plan.
(4) See narrative under the heading ‘‘Extra Service and Pension Benefit Enhancement’’ on page 48 for the explanation of the years of
credited service with respect to Ms. Mayes’ pension benefit enhancement.
The benefits and value of benefits shown in the Pension Benefits table are based on the following material
factors:
Allstate Retirement Plan (‘‘ARP’’)
The ARP has two different types of benefit formulas (final average pay and cash balance) which apply to
participants based on their date of hire or individual choice made prior to the January 1, 2003 introduction of a
cash balance design. Of the named executives, Ms. Mayes and Messrs. Civgin, Lacher, and Winter are eligible to
earn cash balance benefits. Benefits under the final average pay formula are earned and stated in the form of a
straight life annuity payable at the normal retirement date (age 65). Participants who earn final average pay
benefits may do so under one or more benefit formulas based on when they become members of the ARP and
their years of service.
Mr. Wilson has earned ARP benefits under the post-1988 final average pay formula which is the sum of the
Base Benefit and the Additional Benefit, as defined as follows:
●Base Benefit =1.55% of the participant’s average annual compensation, multiplied by credited service after
1988 (limited to 28 years of credited service)
●Additional Benefit =0.65% of the amount, if any, of the participant’s average annual compensation that
exceeds the participant’s covered compensation (the average of the maximum annual salary taxable for
Social Security over the 35-year period ending the year the participant would reach Social Security
retirement age) multiplied by credited service after 1988 (limited to 28 years of credited service)
For participants eligible to earn cash balance benefits, pay credits are added to the cash balance account on
a quarterly basis as a percent of compensation and based on the participant’s years of vesting service as follows:
Cash Balance Plan Pay Credits
Vesting Service Pay Credit %
Less than 1 year 0%
1 year, but less than 5 years 2.5%
5 years, but less than 10 years 3%
10 years, but less than 15 years 4%
15 years, but less than 20 years 5%
20 years, but less than 25 years 6%
25 years or more 7%
46
Proxy Statement


