Allstate 2011 Annual Report Download - page 145
Download and view the complete annual report
Please find page 145 of the 2011 Allstate annual report below. You can navigate through the pages in the report by either clicking on the pages listed below, or by using the keyword search tool below to find specific information within the annual report.-
 1
1 -
2
-
3
-
4
-
5
-
6
-
7
-
8
-
9
-
10
-
11
-
12
-
13
-
14
-
15
-
16
-
17
-
18
-
19
-
20
-
21
-
22
-
23
-
24
-
25
-
26
-
27
-
28
-
29
-
30
-
31
-
32
-
33
-
34
-
35
-
36
-
37
-
38
-
39
-
40
-
41
-
42
-
43
-
44
-
45
-
46
-
47
-
48
-
49
-
50
-
51
-
52
-
53
-
54
-
55
-
56
-
57
-
58
-
59
-
60
-
61
-
62
-
63
-
64
-
65
-
66
-
67
-
68
-
69
-
70
-
71
-
72
-
73
-
74
-
75
-
76
-
77
-
78
-
79
-
80
-
81
-
82
-
83
-
84
-
85
-
86
-
87
-
88
-
89
-
90
-
91
-
92
-
93
-
94
-
95
-
96
-
97
-
98
-
99
-
100
-
101
-
102
-
103
-
104
-
105
-
106
-
107
-
108
-
109
-
110
-
111
-
112
-
113
-
114
-
115
-
116
-
117
-
118
-
119
-
120
-
121
-
122
-
123
-
124
-
125
-
126
-
127
-
128
-
129
-
130
-
131
-
132
-
133
-
134
-
 135
135 -
 136
136 -
 137
137 -
 138
138 -
 139
139 -
 140
140 -
 141
141 -
 142
142 -
 143
143 -
 144
144 -
 145
145 -
 146
146 -
 147
147 -
 148
148 -
 149
149 -
 150
150 -
 151
151 -
 152
152 -
 153
153 -
 154
154 -
 155
155 -
156
-
157
-
158
-
159
-
160
-
161
-
162
-
163
-
164
-
165
-
166
-
167
-
168
-
169
-
170
-
171
-
172
-
173
-
174
-
175
-
176
-
177
-
178
-
179
-
180
-
181
-
182
-
183
-
184
-
185
-
186
-
187
-
188
-
189
-
190
-
191
-
192
-
193
-
194
-
195
-
196
-
197
-
198
-
199
-
200
-
201
-
202
-
203
-
204
-
205
-
206
-
207
-
208
-
209
-
210
-
211
-
212
-
213
-
214
-
215
-
216
-
217
-
218
-
219
-
220
-
221
-
222
-
223
-
224
-
225
-
226
-
227
-
228
-
229
-
230
-
231
-
232
-
233
-
234
-
235
-
236
-
237
-
238
-
239
-
240
-
241
-
242
-
243
-
244
-
245
-
246
-
247
-
248
-
249
-
250
-
251
-
252
-
253
-
254
-
255
-
256
-
257
-
258
-
259
-
260
-
261
-
262
-
263
-
264
-
265
-
266
-
267
-
268
-
269
-
270
-
271
-
272
-
273
-
274
-
275
-
276
 |
 |

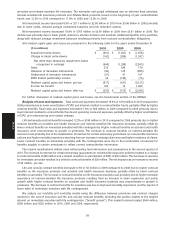
• Reduced our commercial real estate exposure by 18.7% or $2.31 billion of amortized cost primarily through
targeted dispositions and principal repayments from borrowers.
• Maintained hedges to protect our portfolio, primarily against interest rate spikes and equity price declines,
which performed consistently with our positions in relation to the movement in the underlying market indices.
The resulting realized capital losses from our interest rate and equity hedges were offset by the increase in fair
value of our fixed income and equity securities, which is reflected in other comprehensive income (‘‘OCI’’).
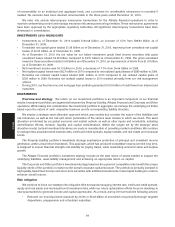
Investments outlook
For 2011, we expect the U.S. and other developed economies to recover at a moderate pace, with greater growth in
developing and emerging countries. These increasing growth expectations should move equity prices higher. Expected
tightening of monetary policy will drive interest rates moderately higher. With expected growth in the economy, credit
markets should continue to improve, but challenges will remain in certain segments such as municipal bonds. As a
result, we plan to focus on the following priorities:
• Optimizing our allocation of assets to align with changes in Allstate Financial’s liabilities.
• Continuing to explore global investments in areas of emerging opportunity with higher prospects for growth.
• Managing the impact of gradually rising rates on our fixed income portfolio.
• Continuing to favor credit risk, while managing our municipal exposure.
As a result of these actions and market conditions:
• Invested assets and income are expected to decline in line with reductions in contractholder obligations for the
Allstate Financial segment.
• Our risk and return optimization actions will allow us to maintain portfolio yields comparable to 2010.
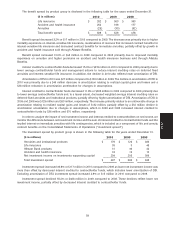
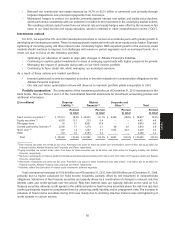
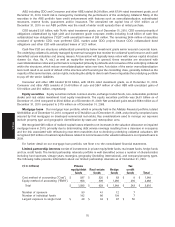
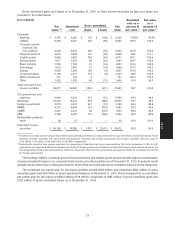
Portfolio composition The composition of the investment portfolios as of December 31, 2010 is presented in the
table below. Also see Notes 2 and 4 of the consolidated financial statements for investment accounting policies and
additional information.
Property- Allstate Corporate and($ in millions)
Liability (5) Financial (5) Other (5) Total
Percent Percent Percent Percent
to total to total to total to total
Fixed income securities (1) $ 27,413 78.2% $ 49,934 81.1% $ 2,265 58.8% $ 79,612 79.2%
Equity securities (2) 4,578 13.1 233 0.4 — — 4,811 4.8
Mortgage loans 18 0.1 6,661 10.8 — — 6,679 6.6
Limited partnership interests (3) 2,506 7.1 1,274 2.1 36 0.9 3,816 3.8
Short-term (4) 430 1.2 1,297 2.1 1,552 40.3 3,279 3.3
Other 103 0.3 2,183 3.5 — — 2,286 2.3
Total $ 35,048 100.0% $ 61,582 100.0% $ 3,853 100.0% $ 100,483 100.0%
(1) Fixed income securities are carried at fair value. Amortized cost basis for these securities was $27.38 billion, $49.19 billion and $2.22 billion for
Property-Liability, Allstate Financial and Corporate and Other, respectively.
(2) Equity securities are carried at fair value. Cost basis for these securities was $4.04 billion and $185 million for Property-Liability and Allstate
Financial, respectively.
(3) We have commitments to invest in additional limited partnership interests totaling $740 million and $731 million for Property-Liability and Allstate
Financial, respectively.
(4) Short-term investments are carried at fair value. Amortized cost basis for these investments was $430 million, $1.30 billion and $1.55 billion for
Property-Liability, Allstate Financial and Corporate and Other, respectively.
(5) Balances reflect the elimination of related party investments between segments.
Total investments increased to $100.48 billion as of December 31, 2010, from $99.83 billion as of December 31, 2009,
primarily due to higher valuations for fixed income securities, partially offset by net reductions in contractholder
obligations. Valuations of fixed income securities are typically driven by a combination of changes in relevant risk-free
interest rates and credit spreads over the period. Risk-free interest rates are typically defined as the yield on U.S.
Treasury securities, whereas credit spread is the additional yield on fixed income securities above the risk-free rate that
market participants require to compensate them for assuming credit, liquidity and/or prepayment risks. The increase in
valuation of fixed income securities during 2010 was mainly due to declining risk-free interest rates and tightening of
credit spreads in certain sectors.
65
MD&A