Allstate 2011 Annual Report Download - page 142
Download and view the complete annual report
Please find page 142 of the 2011 Allstate annual report below. You can navigate through the pages in the report by either clicking on the pages listed below, or by using the keyword search tool below to find specific information within the annual report.-
 1
1 -
2
-
3
-
4
-
5
-
6
-
7
-
8
-
9
-
10
-
11
-
12
-
13
-
14
-
15
-
16
-
17
-
18
-
19
-
20
-
21
-
22
-
23
-
24
-
25
-
26
-
27
-
28
-
29
-
30
-
31
-
32
-
33
-
34
-
35
-
36
-
37
-
38
-
39
-
40
-
41
-
42
-
43
-
44
-
45
-
46
-
47
-
48
-
49
-
50
-
51
-
52
-
53
-
54
-
55
-
56
-
57
-
58
-
59
-
60
-
61
-
62
-
63
-
64
-
65
-
66
-
67
-
68
-
69
-
70
-
71
-
72
-
73
-
74
-
75
-
76
-
77
-
78
-
79
-
80
-
81
-
82
-
83
-
84
-
85
-
86
-
87
-
88
-
89
-
90
-
91
-
92
-
93
-
94
-
95
-
96
-
97
-
98
-
99
-
100
-
101
-
102
-
103
-
104
-
105
-
106
-
107
-
108
-
109
-
110
-
111
-
112
-
113
-
114
-
115
-
116
-
117
-
118
-
119
-
120
-
121
-
122
-
123
-
124
-
125
-
126
-
127
-
128
-
129
-
130
-
131
-
 132
132 -
 133
133 -
 134
134 -
 135
135 -
 136
136 -
 137
137 -
 138
138 -
 139
139 -
 140
140 -
 141
141 -
 142
142 -
 143
143 -
 144
144 -
 145
145 -
 146
146 -
 147
147 -
 148
148 -
 149
149 -
 150
150 -
 151
151 -
 152
152 -
153
-
154
-
155
-
156
-
157
-
158
-
159
-
160
-
161
-
162
-
163
-
164
-
165
-
166
-
167
-
168
-
169
-
170
-
171
-
172
-
173
-
174
-
175
-
176
-
177
-
178
-
179
-
180
-
181
-
182
-
183
-
184
-
185
-
186
-
187
-
188
-
189
-
190
-
191
-
192
-
193
-
194
-
195
-
196
-
197
-
198
-
199
-
200
-
201
-
202
-
203
-
204
-
205
-
206
-
207
-
208
-
209
-
210
-
211
-
212
-
213
-
214
-
215
-
216
-
217
-
218
-
219
-
220
-
221
-
222
-
223
-
224
-
225
-
226
-
227
-
228
-
229
-
230
-
231
-
232
-
233
-
234
-
235
-
236
-
237
-
238
-
239
-
240
-
241
-
242
-
243
-
244
-
245
-
246
-
247
-
248
-
249
-
250
-
251
-
252
-
253
-
254
-
255
-
256
-
257
-
258
-
259
-
260
-
261
-
262
-
263
-
264
-
265
-
266
-
267
-
268
-
269
-
270
-
271
-
272
-
273
-
274
-
275
-
276
 |
 |

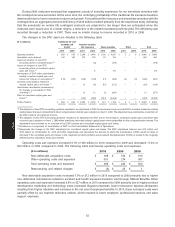
During 2008, indicators emerged that suggested a study of mortality experience for our immediate annuities with
life contingences was warranted. At the same time, the underlying profitability of the traditional life insurance business
deteriorated due to lower investment returns and growth. For traditional life insurance and immediate annuities with life
contingencies, an aggregate premium deficiency of $336 million resulted primarily from the experience study indicating
that the annuitants on certain life contingent contracts are projected to live longer than we anticipated when the
contracts were issued and, to a lesser degree, a reduction in the related investment portfolio yield. The deficiency was
recorded through a reduction in DAC. There was no similar charge to income recorded in 2010 or 2009.
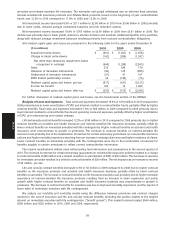
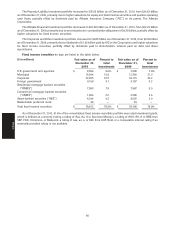
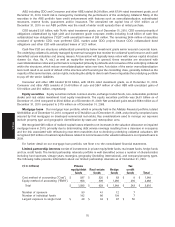
The changes in the DAC asset are detailed in the following table.
Traditional life and($ in millions)
accident and Interest-sensitive
health life insurance Fixed annuities Other Total
2010 2009 2010 2009 2010 2009 2010 2009 2010 2009
Beginning balance $ 650 $ 595 $ 2,246 $ 2,449 $ 1,159 $ 4,037 $ 5 $ 8 $ 4,060 $ 7,089
Acquisition costs deferred 156 162 275 230 52 103 — — 483 495
Impact of adoption of new OTTI
accounting before unrealized impact (1) — — — (6) — (170) — — — (176)
Impact of adoption of new OTTI
accounting effect of unrealized capital
gains and losses (2) ——— 6—170———176
Amortization of DAC before amortization
relating to realized capital gains and
losses and changes in assumptions (3) (113) (107) (140) (176) (71) (186) (2) (3) (326) (472)
Accretion (amortization) relating to
realized capital gains and losses (3) — — 15 (4) (57) (212) — — (42) (216)
Amortization deceleration (acceleration)
for changes in assumptions (‘‘DAC
unlocking’’) (3) — — 13 12 (1) (289) — — 12 (277)
Effect of unrealized capital gains and
losses (4) — — (144) (265) (651) (2,294) — — (795) (2,559)
Ending balance $ 693 $ 650 $ 2,265 $ 2,246 $ 431 $ 1,159 $ 3 $ 5 $ 3,392 $ 4,060
(1) The adoption of new OTTI accounting guidance resulted in an adjustment to DAC to reverse previously recorded DAC accretion related to realized
capital losses that were reclassified to other comprehensive income upon adoption on April 1, 2009. The adjustment was recorded as a reduction of
the DAC balance and retained income.
(2) The adoption of new OTTI accounting guidance resulted in an adjustment to DAC due to the change in unrealized capital gains and losses that
occurred upon adoption on April 1, 2009 when previously recorded realized capital losses were reclassified to other comprehensive income. The
adjustment was recorded as an increase of the DAC balance and unrealized capital gains and losses.
(3) Included as a component of amortization of DAC on the Consolidated Statements of Operations.
(4) Represents the change in the DAC adjustment for unrealized capital gains and losses. The DAC adjustment balance was $75 million and
$870 million as of December 31, 2010 and 2009, respectively, and represents the amount by which the amortization of DAC would increase or
decrease if the unrealized gains and losses in the respective product portfolios were realized. Recapitalization of DAC is limited to the originally
deferred policy acquisition costs plus interest.
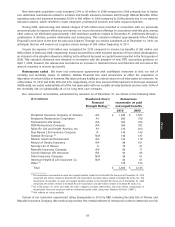
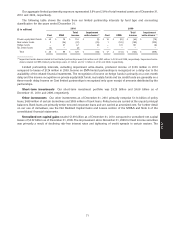
Operating costs and expenses increased 9.1% or $39 million in 2010 compared to 2009 and decreased 17.3% or
$90 million in 2009 compared to 2008. The following table summarizes operating costs and expenses.
($ in millions) 2010 2009 2008
Non-deferrable acquisition costs $ 168 $ 156 $ 153
Other operating costs and expenses 301 274 367
Total operating costs and expenses $ 469 $ 430 $ 520
Restructuring and related charges $ (3) $ 25 $ 1
Non-deferrable acquisition costs increased 7.7% or $12 million in 2010 compared to 2009 primarily due to higher
non-deferrable commissions related to accident and health insurance business sold through Allstate Benefits. Other
operating costs and expenses increased 9.9% or $27 million in 2010 compared to 2009 primarily due to higher product
development, marketing and technology costs, increased litigation expenses, lower reinsurance expense allowances
resulting from higher retention and increases in the net cost of employee benefits. In 2010, these increased costs were
partially offset by our expense reduction actions, which resulted in lower employee, professional services and sales
support expenses.
62
MD&A