Allstate 2011 Annual Report Download - page 122
Download and view the complete annual report
Please find page 122 of the 2011 Allstate annual report below. You can navigate through the pages in the report by either clicking on the pages listed below, or by using the keyword search tool below to find specific information within the annual report.-
 1
1 -
2
-
3
-
4
-
5
-
6
-
7
-
8
-
9
-
10
-
11
-
12
-
13
-
14
-
15
-
16
-
17
-
18
-
19
-
20
-
21
-
22
-
23
-
24
-
25
-
26
-
27
-
28
-
29
-
30
-
31
-
32
-
33
-
34
-
35
-
36
-
37
-
38
-
39
-
40
-
41
-
42
-
43
-
44
-
45
-
46
-
47
-
48
-
49
-
50
-
51
-
52
-
53
-
54
-
55
-
56
-
57
-
58
-
59
-
60
-
61
-
62
-
63
-
64
-
65
-
66
-
67
-
68
-
69
-
70
-
71
-
72
-
73
-
74
-
75
-
76
-
77
-
78
-
79
-
80
-
81
-
82
-
83
-
84
-
85
-
86
-
87
-
88
-
89
-
90
-
91
-
92
-
93
-
94
-
95
-
96
-
97
-
98
-
99
-
100
-
101
-
102
-
103
-
104
-
105
-
106
-
107
-
108
-
109
-
110
-
111
-
 112
112 -
 113
113 -
 114
114 -
 115
115 -
 116
116 -
 117
117 -
 118
118 -
 119
119 -
 120
120 -
 121
121 -
 122
122 -
 123
123 -
 124
124 -
 125
125 -
 126
126 -
 127
127 -
 128
128 -
 129
129 -
 130
130 -
 131
131 -
 132
132 -
133
-
134
-
135
-
136
-
137
-
138
-
139
-
140
-
141
-
142
-
143
-
144
-
145
-
146
-
147
-
148
-
149
-
150
-
151
-
152
-
153
-
154
-
155
-
156
-
157
-
158
-
159
-
160
-
161
-
162
-
163
-
164
-
165
-
166
-
167
-
168
-
169
-
170
-
171
-
172
-
173
-
174
-
175
-
176
-
177
-
178
-
179
-
180
-
181
-
182
-
183
-
184
-
185
-
186
-
187
-
188
-
189
-
190
-
191
-
192
-
193
-
194
-
195
-
196
-
197
-
198
-
199
-
200
-
201
-
202
-
203
-
204
-
205
-
206
-
207
-
208
-
209
-
210
-
211
-
212
-
213
-
214
-
215
-
216
-
217
-
218
-
219
-
220
-
221
-
222
-
223
-
224
-
225
-
226
-
227
-
228
-
229
-
230
-
231
-
232
-
233
-
234
-
235
-
236
-
237
-
238
-
239
-
240
-
241
-
242
-
243
-
244
-
245
-
246
-
247
-
248
-
249
-
250
-
251
-
252
-
253
-
254
-
255
-
256
-
257
-
258
-
259
-
260
-
261
-
262
-
263
-
264
-
265
-
266
-
267
-
268
-
269
-
270
-
271
-
272
-
273
-
274
-
275
-
276
 |
 |

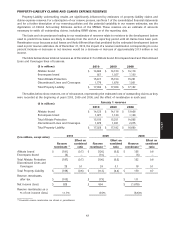
Discontinued Lines and Coverages outlook
• We may continue to experience asbestos and/or environmental losses in the future. These losses could be due
to the potential adverse impact of new information relating to new and additional claims or the impact of
resolving unsettled claims based on unanticipated events such as litigation or legislative, judicial and
regulatory actions. Environmental losses may also increase as the result of additional funding for
environmental site cleanup. Because of our annual grounds up review, we believe that our reserves are
appropriately established based on available information, technology, laws and regulations.
• We continue to be encouraged that the pace of industry asbestos claim activity has slowed, perhaps reflecting
various state legislative and judicial actions with respect to medical criteria and increased legal scrutiny of the
legitimacy of claims.
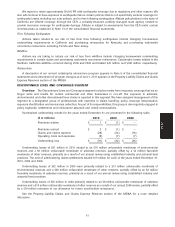
PROPERTY-LIABILITY INVESTMENT RESULTS
Net investment income decreased 10.5% or $139 million to $1.19 billion in 2010 from $1.33 billion in 2009, after
decreasing 20.7% in 2009 compared to 2008. The 2010 decrease was primarily due to lower yields and duration
shortening actions taken to protect the portfolio from rising interest rates, partially offset by higher average investment
balances. The 2009 decrease was primarily due to reduced portfolio yields, actions to shorten duration and maintain
additional liquidity in the portfolio, lower average investment balances and capital contributions to Allstate Life
Insurance Company (‘‘ALIC’’).
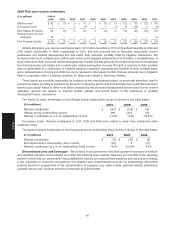
The following table presents the average pre-tax investment yields for the year ended December 31.
2010 (1)(2) 2009 (1)(2) 2008 (1)(2)
Fixed income securities: tax-exempt 4.9% 5.1% 5.1%
Fixed income securities: tax-exempt equivalent 7.1 7.4 7.4
Fixed income securities: taxable 3.5 4.1 5.6
Equity securities 2.3 2.1 3.0
Mortgage loans 5.7 4.7 6.1
Limited partnership interests (3)(4) 3.1 1.5 2.6
Total portfolio (4) 3.8 4.2 4.8
(1) Pre-tax yield is calculated as investment income (including dividend income in the case of equity securities) divided by
the average of the investment balances at the beginning and end of period and interim quarters.
(2) Amortized cost basis is used to calculate the average investment balance for fixed income securities and mortgage
loans. Cost is used for equity securities. Cost or the equity method of accounting basis is used for limited partnership
interests.
(3) Beginning in the fourth quarter of 2008, income from limited partnerships accounted for on the equity method of
accounting (‘‘EMA LP’’) is reported in realized capital gains and losses and is therefore excluded from the
determination of pre-tax investment yields on limited partnership interests. EMA LP income for periods prior to the
fourth quarter of 2008 is reported in net investment income and included in the determination of pre-tax investment
yields on limited partnership interests. For periods beginning with the fourth quarter of 2008, EMA LP’s have been
removed from the yield calculation.
(4) To conform to the current period presentation, prior periods have been reclassified.
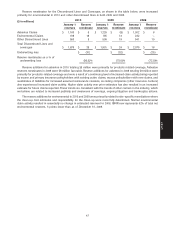
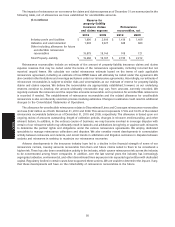
Net realized capital gains and losses are presented in the following table.
($ in millions) 2010 2009 2008
Impairment write-downs $ (295) $ (534) $ (638)
Change in intent write-downs (62) (89) (501)
Net other-than-temporary impairment losses
recognized in earnings (357) (623) (1,139)
Sales 455 611 (635)
Valuation of derivative instruments (331) 52 (296)
Settlements of derivative instruments (143) (203) 289
EMA limited partnership income 55 (5) (77)
Realized capital gains and losses, pre-tax (321) (168) (1,858)
Income tax benefit (expense) 114 (54) 649
Realized capital gains and losses, after-tax $ (207) $ (222) $ (1,209)
For a further discussion of net realized capital gains and losses, see the Investments section of the MD&A.
42
MD&A