Allstate 2011 Annual Report Download - page 112
Download and view the complete annual report
Please find page 112 of the 2011 Allstate annual report below. You can navigate through the pages in the report by either clicking on the pages listed below, or by using the keyword search tool below to find specific information within the annual report.-
 1
1 -
2
-
3
-
4
-
5
-
6
-
7
-
8
-
9
-
10
-
11
-
12
-
13
-
14
-
15
-
16
-
17
-
18
-
19
-
20
-
21
-
22
-
23
-
24
-
25
-
26
-
27
-
28
-
29
-
30
-
31
-
32
-
33
-
34
-
35
-
36
-
37
-
38
-
39
-
40
-
41
-
42
-
43
-
44
-
45
-
46
-
47
-
48
-
49
-
50
-
51
-
52
-
53
-
54
-
55
-
56
-
57
-
58
-
59
-
60
-
61
-
62
-
63
-
64
-
65
-
66
-
67
-
68
-
69
-
70
-
71
-
72
-
73
-
74
-
75
-
76
-
77
-
78
-
79
-
80
-
81
-
82
-
83
-
84
-
85
-
86
-
87
-
88
-
89
-
90
-
91
-
92
-
93
-
94
-
95
-
96
-
97
-
98
-
99
-
100
-
101
-
 102
102 -
 103
103 -
 104
104 -
 105
105 -
 106
106 -
 107
107 -
 108
108 -
 109
109 -
 110
110 -
 111
111 -
 112
112 -
 113
113 -
 114
114 -
 115
115 -
 116
116 -
 117
117 -
 118
118 -
 119
119 -
 120
120 -
 121
121 -
 122
122 -
123
-
124
-
125
-
126
-
127
-
128
-
129
-
130
-
131
-
132
-
133
-
134
-
135
-
136
-
137
-
138
-
139
-
140
-
141
-
142
-
143
-
144
-
145
-
146
-
147
-
148
-
149
-
150
-
151
-
152
-
153
-
154
-
155
-
156
-
157
-
158
-
159
-
160
-
161
-
162
-
163
-
164
-
165
-
166
-
167
-
168
-
169
-
170
-
171
-
172
-
173
-
174
-
175
-
176
-
177
-
178
-
179
-
180
-
181
-
182
-
183
-
184
-
185
-
186
-
187
-
188
-
189
-
190
-
191
-
192
-
193
-
194
-
195
-
196
-
197
-
198
-
199
-
200
-
201
-
202
-
203
-
204
-
205
-
206
-
207
-
208
-
209
-
210
-
211
-
212
-
213
-
214
-
215
-
216
-
217
-
218
-
219
-
220
-
221
-
222
-
223
-
224
-
225
-
226
-
227
-
228
-
229
-
230
-
231
-
232
-
233
-
234
-
235
-
236
-
237
-
238
-
239
-
240
-
241
-
242
-
243
-
244
-
245
-
246
-
247
-
248
-
249
-
250
-
251
-
252
-
253
-
254
-
255
-
256
-
257
-
258
-
259
-
260
-
261
-
262
-
263
-
264
-
265
-
266
-
267
-
268
-
269
-
270
-
271
-
272
-
273
-
274
-
275
-
276
 |
 |

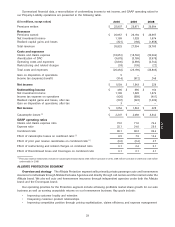
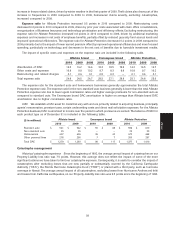
A reconciliation of premiums written to premiums earned is shown in the following table.
2010 2009 2008
($ in millions)
Premiums written:
Allstate Protection $ 25,906 $ 25,972 $ 26,584
Discontinued Lines and Coverages 1 (1) —
Property-Liability premiums written 25,907 25,971 26,584
Decrease in unearned premiums 19 200 383
Other 31 23 —
Property-Liability premiums earned $ 25,957 $ 26,194 $ 26,967
Premiums earned:
Allstate Protection $ 25,955 $ 26,195 $ 26,967
Discontinued Lines and Coverages 2 (1) —
Property-Liability $ 25,957 $ 26,194 $ 26,967
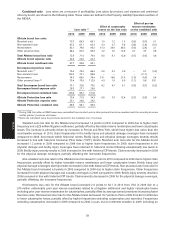
Premiums written by brand are shown in the following table.
Allstate brand Encompass brand Allstate Protection
($ in millions)
2010 2009 2008 2010 2009 2008 2010 2009 2008
Standard auto $ 15,842 $ 15,763 $ 15,918 $ 644 $ 800 $ 1,025 $ 16,486 $ 16,563 $ 16,943
Non-standard auto 883 927 1,018 6 22 40 889 949 1,058
Homeowners 5,753 5,635 5,639 357 408 471 6,110 6,043 6,110
Other personal lines 2,331 2,317 2,358 90 100 115 2,421 2,417 2,473
Total $ 24,809 $ 24,642 $ 24,933 $ 1,097 $ 1,330 $ 1,651 $ 25,906 $ 25,972 $ 26,584
Allstate brand premiums written, excluding Allstate Canada, by the direct channel increased 19.8% to $745 million
in 2010 from $622 million in 2009, reflecting an impact by profitability management actions taken in New York, Florida,
California and North Carolina, following a 25.4% increase from $496 million in 2008. The direct channel includes call
centers and the internet.
Premiums earned by brand are shown in the following tables.
Allstate brand Encompass brand Allstate Protection
($ in millions)
2010 2009 2008 2010 2009 2008 2010 2009 2008
Standard auto $ 15,814 $ 15,735 $ 15,957 $ 716 $ 907 $ 1,091 $ 16,530 $ 16,642 $ 17,048
Non-standard auto 896 939 1,055 9 27 45 905 966 1,100
Homeowners 5,693 5,633 5,758 385 444 503 6,078 6,077 6,261
Other personal lines 2,348 2,402 2,434 94 108 124 2,442 2,510 2,558
Total $ 24,751 $ 24,709 $ 25,204 $ 1,204 $ 1,486 $ 1,763 $ 25,955 $ 26,195 $ 26,967
Premium operating measures and statistics that are used to analyze the business are calculated and described
below. Measures and statistics presented for Allstate brand exclude Allstate Canada, loan protection and specialty auto.
• PIF: Policy counts are based on items rather than customers. A multi-car customer would generate multiple
item (policy) counts, even if all cars were insured under one policy.
• Average premium-gross written: Gross premiums written divided by issued item count. Gross premiums
written include the impacts from discounts and surcharges, and exclude the impacts from mid-term premium
adjustments, ceded reinsurance premiums, and premium refund accruals. Allstate brand average gross
premiums represent the appropriate policy term for each line, which is 6 months for standard and
non-standard auto and 12 months for homeowners. Encompass brand average gross premiums represent the
appropriate policy term for each line, which is 12 months for standard auto and homeowners and 6 months for
non-standard auto.
• Renewal ratio: Renewal policies issued during the period, based on contract effective dates, divided by the
total policies issued 6 months prior for standard and non-standard auto (12 months prior for Encompass brand
standard auto) or 12 months prior for homeowners.
32
MD&A