Allstate 2011 Annual Report Download - page 123
Download and view the complete annual report
Please find page 123 of the 2011 Allstate annual report below. You can navigate through the pages in the report by either clicking on the pages listed below, or by using the keyword search tool below to find specific information within the annual report.-
 1
1 -
2
-
3
-
4
-
5
-
6
-
7
-
8
-
9
-
10
-
11
-
12
-
13
-
14
-
15
-
16
-
17
-
18
-
19
-
20
-
21
-
22
-
23
-
24
-
25
-
26
-
27
-
28
-
29
-
30
-
31
-
32
-
33
-
34
-
35
-
36
-
37
-
38
-
39
-
40
-
41
-
42
-
43
-
44
-
45
-
46
-
47
-
48
-
49
-
50
-
51
-
52
-
53
-
54
-
55
-
56
-
57
-
58
-
59
-
60
-
61
-
62
-
63
-
64
-
65
-
66
-
67
-
68
-
69
-
70
-
71
-
72
-
73
-
74
-
75
-
76
-
77
-
78
-
79
-
80
-
81
-
82
-
83
-
84
-
85
-
86
-
87
-
88
-
89
-
90
-
91
-
92
-
93
-
94
-
95
-
96
-
97
-
98
-
99
-
100
-
101
-
102
-
103
-
104
-
105
-
106
-
107
-
108
-
109
-
110
-
111
-
112
-
 113
113 -
 114
114 -
 115
115 -
 116
116 -
 117
117 -
 118
118 -
 119
119 -
 120
120 -
 121
121 -
 122
122 -
 123
123 -
 124
124 -
 125
125 -
 126
126 -
 127
127 -
 128
128 -
 129
129 -
 130
130 -
 131
131 -
 132
132 -
 133
133 -
134
-
135
-
136
-
137
-
138
-
139
-
140
-
141
-
142
-
143
-
144
-
145
-
146
-
147
-
148
-
149
-
150
-
151
-
152
-
153
-
154
-
155
-
156
-
157
-
158
-
159
-
160
-
161
-
162
-
163
-
164
-
165
-
166
-
167
-
168
-
169
-
170
-
171
-
172
-
173
-
174
-
175
-
176
-
177
-
178
-
179
-
180
-
181
-
182
-
183
-
184
-
185
-
186
-
187
-
188
-
189
-
190
-
191
-
192
-
193
-
194
-
195
-
196
-
197
-
198
-
199
-
200
-
201
-
202
-
203
-
204
-
205
-
206
-
207
-
208
-
209
-
210
-
211
-
212
-
213
-
214
-
215
-
216
-
217
-
218
-
219
-
220
-
221
-
222
-
223
-
224
-
225
-
226
-
227
-
228
-
229
-
230
-
231
-
232
-
233
-
234
-
235
-
236
-
237
-
238
-
239
-
240
-
241
-
242
-
243
-
244
-
245
-
246
-
247
-
248
-
249
-
250
-
251
-
252
-
253
-
254
-
255
-
256
-
257
-
258
-
259
-
260
-
261
-
262
-
263
-
264
-
265
-
266
-
267
-
268
-
269
-
270
-
271
-
272
-
273
-
274
-
275
-
276
 |
 |

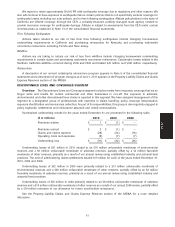
PROPERTY-LIABILITY CLAIMS AND CLAIMS EXPENSE RESERVES
Property-Liability underwriting results are significantly influenced by estimates of property-liability claims and
claims expense reserves. For a description of our reserve process, see Note 7 of the consolidated financial statements
and for a further description of our reserving policies and the potential variability in our reserve estimates, see the
Application of Critical Accounting Estimates section of the MD&A. These reserves are an estimate of amounts
necessary to settle all outstanding claims, including IBNR claims, as of the reporting date.
The facts and circumstances leading to our reestimates of reserves relate to revisions to the development factors
used to predict how losses are likely to develop from the end of a reporting period until all claims have been paid.
Reestimates occur because actual losses are likely different than that predicted by the estimated development factors
used in prior reserve estimates. As of December 31, 2010, the impact of a reserve reestimation corresponding to a one
percent increase or decrease in net reserves would be a decrease or increase of approximately $113 million in net
income.
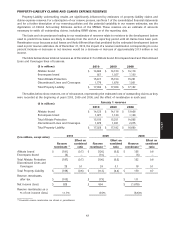
The table below shows total net reserves as of December 31 for Allstate brand, Encompass brand and Discontinued
Lines and Coverages lines of business.
($ in millions) 2010 2009 2008
Allstate brand $ 14,696 $ 14,123 $ 14,118
Encompass brand 921 1,027 1,133
Total Allstate Protection 15,617 15,150 15,251
Discontinued Lines and Coverages 1,779 1,878 1,931
Total Property-Liability $ 17,396 $ 17,028 $ 17,182
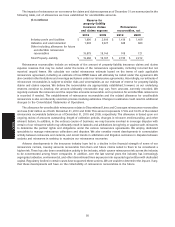
The tables below show reserves, net of reinsurance, representing the estimated cost of outstanding claims as they
were recorded at the beginning of years 2010, 2009 and 2008, and the effect of reestimates in each year.
January 1 reserves
($ in millions)
2010 2009 2008
Allstate brand $ 14,123 $ 14,118 $ 13,456
Encompass brand 1,027 1,133 1,129
Total Allstate Protection 15,150 15,251 14,585
Discontinued Lines and Coverages 1,878 1,931 2,075
Total Property-Liability $ 17,028 $ 17,182 $ 16,660
2010 2009 2008
($ in millions, except ratios)
Effect on Effect on Effect on
Reserve combined Reserve combined Reserve combined
reestimate (1) ratio reestimate (1) ratio reestimate (1) ratio
Allstate brand $ (181) (0.7) $ (126) (0.5) $ 155 0.6
Encompass brand (6) — (10) — (3) —
Total Allstate Protection (187) (0.7) (136) (0.5) 152 0.6
Discontinued Lines and
Coverages 28 0.1 24 0.1 18 0.1
Total Property-Liability $ (159) (0.6) $ (112) (0.4) $ 170 0.7
Reserve reestimates,
after-tax $ (103) $ (73) $ 111
Net income (loss) $ 928 $ 854 $ (1,679)
Reserve reestimates as a
% of net income (loss) 11.1% 8.5% (6.6)%
(1) Favorable reserve reestimates are shown in parentheses.
43
MD&A