Allstate 2011 Annual Report Download - page 259
Download and view the complete annual report
Please find page 259 of the 2011 Allstate annual report below. You can navigate through the pages in the report by either clicking on the pages listed below, or by using the keyword search tool below to find specific information within the annual report.-
 1
1 -
2
-
3
-
4
-
5
-
6
-
7
-
8
-
9
-
10
-
11
-
12
-
13
-
14
-
15
-
16
-
17
-
18
-
19
-
20
-
21
-
22
-
23
-
24
-
25
-
26
-
27
-
28
-
29
-
30
-
31
-
32
-
33
-
34
-
35
-
36
-
37
-
38
-
39
-
40
-
41
-
42
-
43
-
44
-
45
-
46
-
47
-
48
-
49
-
50
-
51
-
52
-
53
-
54
-
55
-
56
-
57
-
58
-
59
-
60
-
61
-
62
-
63
-
64
-
65
-
66
-
67
-
68
-
69
-
70
-
71
-
72
-
73
-
74
-
75
-
76
-
77
-
78
-
79
-
80
-
81
-
82
-
83
-
84
-
85
-
86
-
87
-
88
-
89
-
90
-
91
-
92
-
93
-
94
-
95
-
96
-
97
-
98
-
99
-
100
-
101
-
102
-
103
-
104
-
105
-
106
-
107
-
108
-
109
-
110
-
111
-
112
-
113
-
114
-
115
-
116
-
117
-
118
-
119
-
120
-
121
-
122
-
123
-
124
-
125
-
126
-
127
-
128
-
129
-
130
-
131
-
132
-
133
-
134
-
135
-
136
-
137
-
138
-
139
-
140
-
141
-
142
-
143
-
144
-
145
-
146
-
147
-
148
-
149
-
150
-
151
-
152
-
153
-
154
-
155
-
156
-
157
-
158
-
159
-
160
-
161
-
162
-
163
-
164
-
165
-
166
-
167
-
168
-
169
-
170
-
171
-
172
-
173
-
174
-
175
-
176
-
177
-
178
-
179
-
180
-
181
-
182
-
183
-
184
-
185
-
186
-
187
-
188
-
189
-
190
-
191
-
192
-
193
-
194
-
195
-
196
-
197
-
198
-
199
-
200
-
201
-
202
-
203
-
204
-
205
-
206
-
207
-
208
-
209
-
210
-
211
-
212
-
213
-
214
-
215
-
216
-
217
-
218
-
219
-
220
-
221
-
222
-
223
-
224
-
225
-
226
-
227
-
228
-
229
-
230
-
231
-
232
-
233
-
234
-
235
-
236
-
237
-
238
-
239
-
240
-
241
-
242
-
243
-
244
-
245
-
246
-
247
-
248
-
 249
249 -
 250
250 -
 251
251 -
 252
252 -
 253
253 -
 254
254 -
 255
255 -
 256
256 -
 257
257 -
 258
258 -
 259
259 -
 260
260 -
 261
261 -
 262
262 -
 263
263 -
 264
264 -
 265
265 -
 266
266 -
 267
267 -
 268
268 -
 269
269 -
270
-
271
-
272
-
273
-
274
-
275
-
276
 |
 |

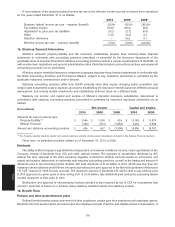
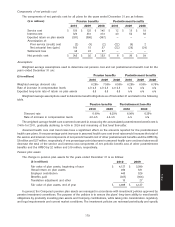
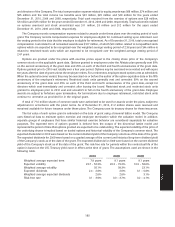
Components of net periodic cost
The components of net periodic cost for all plans for the years ended December 31 are as follows:
($ in millions) Pension benefits Postretirement benefits
2010 2009 2008 2010 2009 2008
Service cost $ 150 $ 125 $ 145 $ 12 $ 13 $ 18
Interest cost 320 331 313 40 52 58
Expected return on plan assets (331) (398) (397) — — —
Amortization of:
Prior service (credit) cost (2) (3) (2) (22) (6) 2
Net actuarial loss (gain) 160 15 37 (22) (29) (24)
Settlement loss 48 22 57 — — —
Net periodic cost $ 345 $ 92 $ 153 $ 8 $ 30 $ 54
Assumptions
Weighted average assumptions used to determine net pension cost and net postretirement benefit cost for the
years ended December 31 are:
Pension benefits Postretirement benefits
($ in millions)
2010 2009 2008 2010 2009 2008
Weighted average discount rate 6.25% 7.50% 6.50% 6.25% 6.50% 6.75%
Rate of increase in compensation levels 4.0-4.5 4.0-4.5 4.0-4.5 n/a n/a n/a
Expected long-term rate of return on plan assets 8.5 8.5 8.5 n/a n/a n/a
Weighted average assumptions used to determine benefit obligations as of December 31 are listed in the following
table.
Pension benefits Postretirement benefits
2010 2009 2010 2009
Discount rate 6.00% 6.25% 6.00% 6.25%
Rate of increase in compensation levels 4.0-4.5 4.0-4.5 n/a n/a
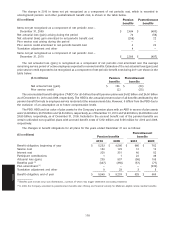
The weighted average health care cost trend rate used in measuring the accumulated postretirement benefit cost is
7.40% for 2011, gradually declining to 4.5% in 2024 and remaining at that level thereafter.
Assumed health care cost trend rates have a significant effect on the amounts reported for the postretirement
health care plans. A one percentage-point increase in assumed health care cost trend rates would increase the total of
the service and interest cost components of net periodic benefit cost of other postretirement benefits and the APBO by
$3 million and $27 million, respectively. A one percentage-point decrease in assumed health care cost trend rates would
decrease the total of the service and interest cost components of net periodic benefit cost of other postretirement
benefits and the APBO by $2 million and $19 million, respectively.
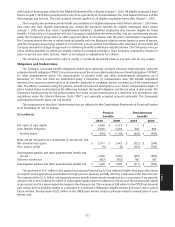
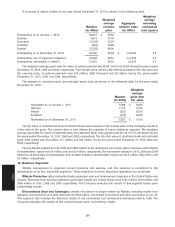
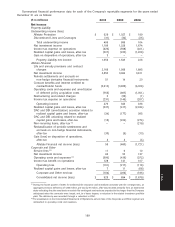
Pension plan assets
The change in pension plan assets for the years ended December 31 is as follows:
($ in millions) 2010 2009
Fair value of plan assets, beginning of year $ 4,127 $ 3,399
Actual return on plan assets 496 531
Employer contribution 443 526
Benefits paid (407) (356)
Translation adjustment and other 10 27
Fair value of plan assets, end of year $ 4,669 $ 4,127
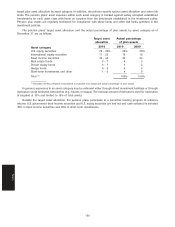
In general, the Company’s pension plan assets are managed in accordance with investment policies approved by
pension investment committees. The purpose of the policies is to ensure the plans’ long-term ability to meet benefit
obligations by prudently investing plan assets and Company contributions, while taking into consideration regulatory
and legal requirements and current market conditions. The investment policies are reviewed periodically and specify
179
Notes