Allstate 2011 Annual Report Download - page 101
Download and view the complete annual report
Please find page 101 of the 2011 Allstate annual report below. You can navigate through the pages in the report by either clicking on the pages listed below, or by using the keyword search tool below to find specific information within the annual report.-
 1
1 -
2
-
3
-
4
-
5
-
6
-
7
-
8
-
9
-
10
-
11
-
12
-
13
-
14
-
15
-
16
-
17
-
18
-
19
-
20
-
21
-
22
-
23
-
24
-
25
-
26
-
27
-
28
-
29
-
30
-
31
-
32
-
33
-
34
-
35
-
36
-
37
-
38
-
39
-
40
-
41
-
42
-
43
-
44
-
45
-
46
-
47
-
48
-
49
-
50
-
51
-
52
-
53
-
54
-
55
-
56
-
57
-
58
-
59
-
60
-
61
-
62
-
63
-
64
-
65
-
66
-
67
-
68
-
69
-
70
-
71
-
72
-
73
-
74
-
75
-
76
-
77
-
78
-
79
-
80
-
81
-
82
-
83
-
84
-
85
-
86
-
87
-
88
-
89
-
90
-
 91
91 -
 92
92 -
 93
93 -
 94
94 -
 95
95 -
 96
96 -
 97
97 -
 98
98 -
 99
99 -
 100
100 -
 101
101 -
 102
102 -
 103
103 -
 104
104 -
 105
105 -
 106
106 -
 107
107 -
 108
108 -
 109
109 -
 110
110 -
 111
111 -
112
-
113
-
114
-
115
-
116
-
117
-
118
-
119
-
120
-
121
-
122
-
123
-
124
-
125
-
126
-
127
-
128
-
129
-
130
-
131
-
132
-
133
-
134
-
135
-
136
-
137
-
138
-
139
-
140
-
141
-
142
-
143
-
144
-
145
-
146
-
147
-
148
-
149
-
150
-
151
-
152
-
153
-
154
-
155
-
156
-
157
-
158
-
159
-
160
-
161
-
162
-
163
-
164
-
165
-
166
-
167
-
168
-
169
-
170
-
171
-
172
-
173
-
174
-
175
-
176
-
177
-
178
-
179
-
180
-
181
-
182
-
183
-
184
-
185
-
186
-
187
-
188
-
189
-
190
-
191
-
192
-
193
-
194
-
195
-
196
-
197
-
198
-
199
-
200
-
201
-
202
-
203
-
204
-
205
-
206
-
207
-
208
-
209
-
210
-
211
-
212
-
213
-
214
-
215
-
216
-
217
-
218
-
219
-
220
-
221
-
222
-
223
-
224
-
225
-
226
-
227
-
228
-
229
-
230
-
231
-
232
-
233
-
234
-
235
-
236
-
237
-
238
-
239
-
240
-
241
-
242
-
243
-
244
-
245
-
246
-
247
-
248
-
249
-
250
-
251
-
252
-
253
-
254
-
255
-
256
-
257
-
258
-
259
-
260
-
261
-
262
-
263
-
264
-
265
-
266
-
267
-
268
-
269
-
270
-
271
-
272
-
273
-
274
-
275
-
276
 |
 |

Reserves are reestimated quarterly, by combining historical results with current actual results to calculate new
development factors. This process incorporates the historic and latest actual trends, and other underlying changes in
the data elements used to calculate reserve estimates. New development factors are likely to differ from previous
development factors used in prior reserve estimates because actual results (claims reported or settled, losses paid, or
changes to case reserves) occur differently than the implied assumptions contained in the previous development factor
calculations. If claims reported, paid losses, or case reserve changes are greater or less than the levels estimated by
previous development factors, reserve reestimates increase or decrease. When actual development of these data
elements is different than the historical development pattern used in a prior period reserve estimate, a new reserve is
determined. The difference between indicated reserves based on new reserve estimates and recorded reserves (the
previous estimate) is the amount of reserve reestimate and is recognized as an increase or decrease in property-liability
insurance claims and claims expense in the Consolidated Statements of Operations. Total Property-liability reserve
reestimates, after-tax, as a percent of net income in 2010, 2009 and 2008 were 11.1%, 8.5%, and (6.6)%, respectively. For
Property-Liability, the 3-year average of reserve reestimates as a percentage of total reserves was a favorable 0.2%, for
Allstate Protection, the 3-year average of reserve estimates was a favorable 0.4% and for Discontinued Lines and
Coverages, the 3-year average of reserve reestimates was an unfavorable 1.2%, each of these results being consistent
within a reasonable actuarial tolerance for our respective businesses. A more detailed discussion of reserve reestimates
is presented in the Property-Liability Claims and Claims Expense Reserves section of this document.
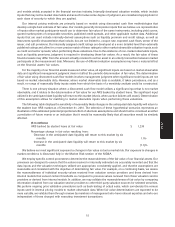
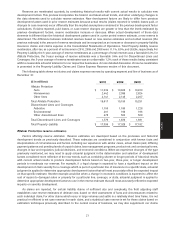
The following table shows net claims and claims expense reserves by operating segment and line of business as of
December 31:
($ in millions) 2010 2009 2008
Allstate Protection
Auto $ 11,034 $ 10,606 $ 10,220
Homeowners 2,442 2,399 2,824
Other lines 2,141 2,145 2,207
Total Allstate Protection 15,617 15,150 15,251
Discontinued Lines and Coverages
Asbestos 1,100 1,180 1,228
Environmental 201 198 195
Other discontinued lines 478 500 508
Total Discontinued Lines and Coverages 1,779 1,878 1,931
Total Property-Liability $ 17,396 $ 17,028 $ 17,182
Allstate Protection reserve estimates
Factors affecting reserve estimates Reserve estimates are developed based on the processes and historical
development trends as previously described. These estimates are considered in conjunction with known facts and
interpretations of circumstances and factors including our experience with similar cases, actual claims paid, differing
payment patterns and pending levels of unpaid claims, loss management programs, product mix and contractual terms,
changes in law and regulation, judicial decisions, and economic conditions. When we experience changes of the type
previously mentioned, we may need to apply actuarial judgment in the determination and selection of development
factors considered more reflective of the new trends, such as combining shorter or longer periods of historical results
with current actual results to produce development factors based on two-year, three-year, or longer development
periods to reestimate our reserves. For example, if a legal change is expected to have a significant impact on the
development of claim severity for a coverage which is part of a particular line of insurance in a specific state, actuarial
judgment is applied to determine appropriate development factors that will most accurately reflect the expected impact
on that specific estimate. Another example would be when a change in economic conditions is expected to affect the
cost of repairs to damaged autos or property for a particular line, coverage, or state, actuarial judgment is applied to
determine appropriate development factors to use in the reserve estimate that will most accurately reflect the expected
impacts on severity development.
As claims are reported, for certain liability claims of sufficient size and complexity, the field adjusting staff
establishes case reserve estimates of ultimate cost, based on their assessment of facts and circumstances related to
each individual claim. For other claims which occur in large volumes and settle in a relatively short time frame, it is not
practical or efficient to set case reserves for each claim, and a statistical case reserve is set for these claims based on
estimation techniques previously described. In the normal course of business, we may also supplement our claims
21
MD&A