Allstate 2011 Annual Report Download - page 39
Download and view the complete annual report
Please find page 39 of the 2011 Allstate annual report below. You can navigate through the pages in the report by either clicking on the pages listed below, or by using the keyword search tool below to find specific information within the annual report.-
 1
1 -
2
-
3
-
4
-
5
-
6
-
7
-
8
-
9
-
10
-
11
-
12
-
13
-
14
-
15
-
16
-
17
-
18
-
19
-
20
-
21
-
22
-
23
-
24
-
25
-
26
-
27
-
28
-
 29
29 -
 30
30 -
 31
31 -
 32
32 -
 33
33 -
 34
34 -
 35
35 -
 36
36 -
 37
37 -
 38
38 -
 39
39 -
 40
40 -
 41
41 -
 42
42 -
 43
43 -
 44
44 -
 45
45 -
 46
46 -
 47
47 -
 48
48 -
 49
49 -
50
-
51
-
52
-
53
-
54
-
55
-
56
-
57
-
58
-
59
-
60
-
61
-
62
-
63
-
64
-
65
-
66
-
67
-
68
-
69
-
70
-
71
-
72
-
73
-
74
-
75
-
76
-
77
-
78
-
79
-
80
-
81
-
82
-
83
-
84
-
85
-
86
-
87
-
88
-
89
-
90
-
91
-
92
-
93
-
94
-
95
-
96
-
97
-
98
-
99
-
100
-
101
-
102
-
103
-
104
-
105
-
106
-
107
-
108
-
109
-
110
-
111
-
112
-
113
-
114
-
115
-
116
-
117
-
118
-
119
-
120
-
121
-
122
-
123
-
124
-
125
-
126
-
127
-
128
-
129
-
130
-
131
-
132
-
133
-
134
-
135
-
136
-
137
-
138
-
139
-
140
-
141
-
142
-
143
-
144
-
145
-
146
-
147
-
148
-
149
-
150
-
151
-
152
-
153
-
154
-
155
-
156
-
157
-
158
-
159
-
160
-
161
-
162
-
163
-
164
-
165
-
166
-
167
-
168
-
169
-
170
-
171
-
172
-
173
-
174
-
175
-
176
-
177
-
178
-
179
-
180
-
181
-
182
-
183
-
184
-
185
-
186
-
187
-
188
-
189
-
190
-
191
-
192
-
193
-
194
-
195
-
196
-
197
-
198
-
199
-
200
-
201
-
202
-
203
-
204
-
205
-
206
-
207
-
208
-
209
-
210
-
211
-
212
-
213
-
214
-
215
-
216
-
217
-
218
-
219
-
220
-
221
-
222
-
223
-
224
-
225
-
226
-
227
-
228
-
229
-
230
-
231
-
232
-
233
-
234
-
235
-
236
-
237
-
238
-
239
-
240
-
241
-
242
-
243
-
244
-
245
-
246
-
247
-
248
-
249
-
250
-
251
-
252
-
253
-
254
-
255
-
256
-
257
-
258
-
259
-
260
-
261
-
262
-
263
-
264
-
265
-
266
-
267
-
268
-
269
-
270
-
271
-
272
-
273
-
274
-
275
-
276
 |
 |

3MAR201101085362 3MAR201101085110
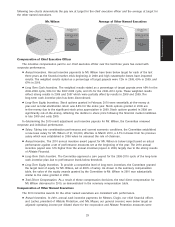
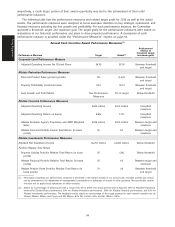
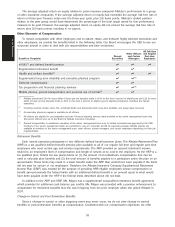
following two charts demonstrate the pay mix at target for the chief executive officer and the average at target for
the other named executives.
Mr. Wilson Average of Other Named Executives
Salary
12%
Pay at Risk
88%
Annual Incentive
18%
Restricted Stock Units
24%
Stock Options
46%
Salary
19%
Pay at Risk
81%
Annual Incentive
20%
Restricted Stock Units
21%
Stock Options
40%
Compensation of Chief Executive Officer
The incentive compensation paid to our chief executive officer over the last three years has varied with
corporate performance.
●Annual Incentives. Annual incentive payments to Mr. Wilson have been below target for each of the last
three years as the financial market crisis beginning in 2008 and high catastrophe losses have impacted
results. The weighted results stated as a percentage of target payouts were 12% in 2008, 60% in 2009, and
67% in 2010.
●Long Term Cash Incentives. The weighted results stated as a percentage of target payouts were 45% for the
2006-2008 cycle, 50% for the 2007-2009 cycle, and 0% for the 2008-2010 cycle. These weighted results
reflect strong results in 2006 and 2007 which were partially offset by results in 2008 and 2009. The
long-term cash incentive plan has been discontinued.
●Long-Term Equity Incentives. Stock options granted in February 2010 were essentially at-the-money at
year-end as total stockholder return was 8.8% for the entire year. Stock options granted in 2009 are
in-the-money due to the significant stock price appreciation in 2009. Stock options granted in 2008 are
significantly out-of-the-money reflecting the decline in share price following the financial market meltdown
in late 2008 and early 2009.
In determining the 2010 merit adjustment and incentive payouts for Mr. Wilson, the Committee reviewed
corporate and individual performance.
●Salary. Taking into consideration performance and current economic conditions, the Committee established
a new base salary for Mr. Wilson of $1,100,000, effective in March 2010, a 3.7% increase from his previous
salary which was established in 2008 when he assumed the role of chairman.
●Annual Incentive. The 2010 annual incentive award payout for Mr. Wilson is below target based on actual
performance against a set of performance measures set at the beginning of the year. The 2010 annual
incentive payout was 12% higher than the annual incentive payout in 2009, largely due to the strong results
of Allstate Financial.
●Long-Term Cash Incentive. The Committee approved a zero payout for the 2008-2010 cycle of the long-term
cash incentive plan due to performance levels below threshold.
●Long-Term Equity Incentives. To provide a competitive level of long-term incentives, the Committee granted
the target level of equity for Mr. Wilson, set at 600% of salary. As shown in the summary compensation
table, the value of the equity awards granted by the Committee to Mr. Wilson in 2010 was substantially
similar to the value granted in 2009.
●Total Direct Compensation. As a result of these compensation decisions, the total direct compensation for
Mr. Wilson decreased in 2010, as demonstrated in the summary compensation table.
Compensation of Other Named Executives
The 2010 incentive awards for the other named executives are consistent with performance.
●Annual Incentives. In 2010, annual cash incentive payments for Messrs. Civgin, our chief financial officer,
and Lacher, president of Allstate Protection, and Ms. Mayes, our general counsel, were below target as
adjusted operating income per diluted share for the corporation and Allstate Protection measures were
29
Proxy Statement