Allstate 2011 Annual Report Download - page 170
Download and view the complete annual report
Please find page 170 of the 2011 Allstate annual report below. You can navigate through the pages in the report by either clicking on the pages listed below, or by using the keyword search tool below to find specific information within the annual report.-
 1
1 -
2
-
3
-
4
-
5
-
6
-
7
-
8
-
9
-
10
-
11
-
12
-
13
-
14
-
15
-
16
-
17
-
18
-
19
-
20
-
21
-
22
-
23
-
24
-
25
-
26
-
27
-
28
-
29
-
30
-
31
-
32
-
33
-
34
-
35
-
36
-
37
-
38
-
39
-
40
-
41
-
42
-
43
-
44
-
45
-
46
-
47
-
48
-
49
-
50
-
51
-
52
-
53
-
54
-
55
-
56
-
57
-
58
-
59
-
60
-
61
-
62
-
63
-
64
-
65
-
66
-
67
-
68
-
69
-
70
-
71
-
72
-
73
-
74
-
75
-
76
-
77
-
78
-
79
-
80
-
81
-
82
-
83
-
84
-
85
-
86
-
87
-
88
-
89
-
90
-
91
-
92
-
93
-
94
-
95
-
96
-
97
-
98
-
99
-
100
-
101
-
102
-
103
-
104
-
105
-
106
-
107
-
108
-
109
-
110
-
111
-
112
-
113
-
114
-
115
-
116
-
117
-
118
-
119
-
120
-
121
-
122
-
123
-
124
-
125
-
126
-
127
-
128
-
129
-
130
-
131
-
132
-
133
-
134
-
135
-
136
-
137
-
138
-
139
-
140
-
141
-
142
-
143
-
144
-
145
-
146
-
147
-
148
-
149
-
150
-
151
-
152
-
153
-
154
-
155
-
156
-
157
-
158
-
159
-
 160
160 -
 161
161 -
 162
162 -
 163
163 -
 164
164 -
 165
165 -
 166
166 -
 167
167 -
 168
168 -
 169
169 -
 170
170 -
 171
171 -
 172
172 -
 173
173 -
 174
174 -
 175
175 -
 176
176 -
 177
177 -
 178
178 -
 179
179 -
 180
180 -
181
-
182
-
183
-
184
-
185
-
186
-
187
-
188
-
189
-
190
-
191
-
192
-
193
-
194
-
195
-
196
-
197
-
198
-
199
-
200
-
201
-
202
-
203
-
204
-
205
-
206
-
207
-
208
-
209
-
210
-
211
-
212
-
213
-
214
-
215
-
216
-
217
-
218
-
219
-
220
-
221
-
222
-
223
-
224
-
225
-
226
-
227
-
228
-
229
-
230
-
231
-
232
-
233
-
234
-
235
-
236
-
237
-
238
-
239
-
240
-
241
-
242
-
243
-
244
-
245
-
246
-
247
-
248
-
249
-
250
-
251
-
252
-
253
-
254
-
255
-
256
-
257
-
258
-
259
-
260
-
261
-
262
-
263
-
264
-
265
-
266
-
267
-
268
-
269
-
270
-
271
-
272
-
273
-
274
-
275
-
276
 |
 |

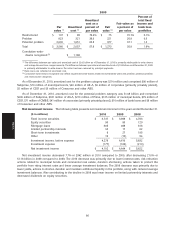
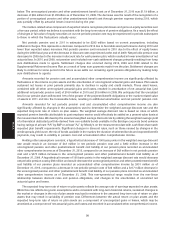
2010 2009 2008 2010 Explanations
($ in millions)
Valuation Settlements Total Total Total
Allstate Financial
Duration gap (111) (43) (154) 288 (503) Interest rate caps, floors, swaptions and swaps are used by Allstate Financial to
management balance interest-rate sensitivities of its assets and liabilities. The contracts settle
based on differences between current market rates and a contractually specified
fixed rate through expiration. The contracts can be terminated and settled at any
time with minimal additional cost. The maximum loss on caps, floors and swaptions
is limited to the amount of premiums paid. The change in valuation reflects the
changing value of expected future settlements from changing interest rates, which
may vary over the period of the contracts. The 2010 losses, resulting from
decreasing interest rates, are offset in unrealized capital gains and losses of our
fixed income securities in OCI to the extent it relates to changes in risk-free rates.
Anticipatory hedging 24 8 32 (18) 153 Futures and interest rate swaps are used to protect investment spread from
interest rate changes during mismatches in the timing of cash flows between
product sales and the related investment activity. The futures contracts are
exchange traded, daily cash settled and can be exited at any time for minimal
additional cost. If the cash flow mismatches are such that a positive net investment
position is being hedged, there is an offset for the related investment’s unrealized
loss in OCI. The 2010 gains resulted from a decrease in risk-free interest rates over
the life of the net short position as liability issuances exceeded asset acquisitions.
Hedging of interest (16) — (16) 10 (29) Value of expected future settlements on interest rate caps and the associated value
rate exposure in of future credited interest, which is reportable in future periods when incurred,
annuity contracts decreased due to a decrease in interest rates.
Hedging unrealized — — — — 7
gains on equity
indexed notes
Hedge ineffectiveness 7 — 7 (1) (4) The hedge ineffectiveness of $7 million includes $74 million in realized capital
losses on swaps that were offset by $81 million in realized capital gains on the
hedged risk.
Foreign currency (2) 6 4 3 (1) Currency forwards are used to protect our foreign bond portfolio from changes in
contracts currency rates.
Credit risk reduction (1) 6 (13) (7) (50) 17 Valuation gain is the result of widening credit spreads on referenced credit entities.
Other — — — — 1
Total Risk $ (417) $ (195) $ (612) $ (58) $ (54)
management
Income generation
The 2010 changes in valuation on the Property-Liability segment are due to theAsset replication —
tightening of credit spreads on referenced credit entities. The gains are primarily oncredit exposure
single name credit default swaps (‘‘CDS’’). The 2010 changes in valuation on theProperty-Liability $ 5 $ 10 $ 15 $ 13 $ (41)
Allstate Financial segment are due to the widening credit spreads on referencedAllstate Financial (10) 11 1 64 (62)
credit entities. The losses are primarily on first-to-default CDS and credit derivative
Total (5) 21 16 77 (103) index CDS. The changes in valuation would only be converted to cash upon
disposition, which can be done at any time, or if the credit event specified in the
contract occurs. For further discussion on CDS, see Note 6 of the consolidated
financial statements.
Asset replication —
equity exposure
Property–Liability — — — 66 (84)
Commodity derivatives —
Property–Liability — — — — (44)
Total Income
generation $ (5) $ 21 $ 16 $ 143 $ (231)
90
MD&A