Allstate 2011 Annual Report Download - page 206
Download and view the complete annual report
Please find page 206 of the 2011 Allstate annual report below. You can navigate through the pages in the report by either clicking on the pages listed below, or by using the keyword search tool below to find specific information within the annual report.-
 1
1 -
2
-
3
-
4
-
5
-
6
-
7
-
8
-
9
-
10
-
11
-
12
-
13
-
14
-
15
-
16
-
17
-
18
-
19
-
20
-
21
-
22
-
23
-
24
-
25
-
26
-
27
-
28
-
29
-
30
-
31
-
32
-
33
-
34
-
35
-
36
-
37
-
38
-
39
-
40
-
41
-
42
-
43
-
44
-
45
-
46
-
47
-
48
-
49
-
50
-
51
-
52
-
53
-
54
-
55
-
56
-
57
-
58
-
59
-
60
-
61
-
62
-
63
-
64
-
65
-
66
-
67
-
68
-
69
-
70
-
71
-
72
-
73
-
74
-
75
-
76
-
77
-
78
-
79
-
80
-
81
-
82
-
83
-
84
-
85
-
86
-
87
-
88
-
89
-
90
-
91
-
92
-
93
-
94
-
95
-
96
-
97
-
98
-
99
-
100
-
101
-
102
-
103
-
104
-
105
-
106
-
107
-
108
-
109
-
110
-
111
-
112
-
113
-
114
-
115
-
116
-
117
-
118
-
119
-
120
-
121
-
122
-
123
-
124
-
125
-
126
-
127
-
128
-
129
-
130
-
131
-
132
-
133
-
134
-
135
-
136
-
137
-
138
-
139
-
140
-
141
-
142
-
143
-
144
-
145
-
146
-
147
-
148
-
149
-
150
-
151
-
152
-
153
-
154
-
155
-
156
-
157
-
158
-
159
-
160
-
161
-
162
-
163
-
164
-
165
-
166
-
167
-
168
-
169
-
170
-
171
-
172
-
173
-
174
-
175
-
176
-
177
-
178
-
179
-
180
-
181
-
182
-
183
-
184
-
185
-
186
-
187
-
188
-
189
-
190
-
191
-
192
-
193
-
194
-
195
-
 196
196 -
 197
197 -
 198
198 -
 199
199 -
 200
200 -
 201
201 -
 202
202 -
 203
203 -
 204
204 -
 205
205 -
 206
206 -
 207
207 -
 208
208 -
 209
209 -
 210
210 -
 211
211 -
 212
212 -
 213
213 -
 214
214 -
 215
215 -
 216
216 -
217
-
218
-
219
-
220
-
221
-
222
-
223
-
224
-
225
-
226
-
227
-
228
-
229
-
230
-
231
-
232
-
233
-
234
-
235
-
236
-
237
-
238
-
239
-
240
-
241
-
242
-
243
-
244
-
245
-
246
-
247
-
248
-
249
-
250
-
251
-
252
-
253
-
254
-
255
-
256
-
257
-
258
-
259
-
260
-
261
-
262
-
263
-
264
-
265
-
266
-
267
-
268
-
269
-
270
-
271
-
272
-
273
-
274
-
275
-
276
 |
 |

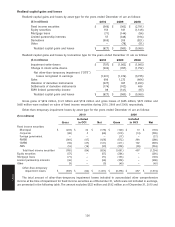
Realized capital gains and losses
Realized capital gains and losses by asset type for the years ended December 31 are as follows:
($ in millions) 2010 2009 2008
Fixed income securities $ (366) $ (302) $ (2,781)
Equity securities 153 181 (1,149)
Mortgage loans (71) (144) (94)
Limited partnership interests 57 (446) (194)
Derivatives (600) 206 (821)
Other — (78) (51)
Realized capital gains and losses $ (827) $ (583) $ (5,090)
Realized capital gains and losses by transaction type for the years ended December 31 are as follows:
($ in millions) 2010 2009 2008
Impairment write-downs $ (797) $ (1,562) $ (1,983)
Change in intent write-downs (204) (357) (1,752)
Net other-than-temporary impairment (‘‘OTTI’’)
losses recognized in earnings (1,001) (1,919) (3,735)
Sales 686 1,272 (464)
Valuation of derivative instruments (427) 367 (1,280)
Settlements of derivative instruments (174) (162) 486
EMA limited partnership income 89 (141) (97)
Realized capital gains and losses $ (827) $ (583) $ (5,090)
Gross gains of $819 million, $1.21 billion and $718 million and gross losses of $435 million, $373 million and
$485 million were realized on sales of fixed income securities during 2010, 2009 and 2008, respectively.
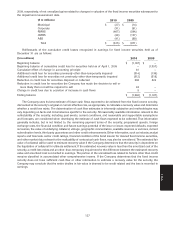
Other-than-temporary impairment losses by asset type for the years ended December 31 are as follows:
2010 2009
($ in millions)
Included Included
Gross in OCI Net Gross in OCI Net
Fixed income securities:
Municipal $ (203) $ 24 $ (179) $ (140) $ 10 $ (130)
Corporate (68) 2 (66) (213) (13) (226)
Foreign government — — — (17) — (17)
RMBS (381) (47) (428) (672) 384 (288)
CMBS (94) (27) (121) (411) 102 (309)
ABS (14) (16) (30) (208) (26) (234)
Total fixed income securities (760) (64) (824) (1,661) 457 (1,204)
Equity securities (57) — (57) (264) — (264)
Mortgage loans (71) — (71) (103) — (103)
Limited partnership interests (46) — (46) (308) — (308)
Other (3) — (3) (40) — (40)
Other-than-temporary
impairment losses $ (937) $ (64) $ (1,001) $ (2,376) $ 457 $ (1,919)
The total amount of other-than-temporary impairment losses included in accumulated other comprehensive
income at the time of impairment for fixed income securities as of December 31, which were not included in earnings,
are presented in the following table. The amount excludes $322 million and $192 million as of December 31, 2010 and
126
Notes