Allstate 2011 Annual Report Download - page 159
Download and view the complete annual report
Please find page 159 of the 2011 Allstate annual report below. You can navigate through the pages in the report by either clicking on the pages listed below, or by using the keyword search tool below to find specific information within the annual report.-
 1
1 -
2
-
3
-
4
-
5
-
6
-
7
-
8
-
9
-
10
-
11
-
12
-
13
-
14
-
15
-
16
-
17
-
18
-
19
-
20
-
21
-
22
-
23
-
24
-
25
-
26
-
27
-
28
-
29
-
30
-
31
-
32
-
33
-
34
-
35
-
36
-
37
-
38
-
39
-
40
-
41
-
42
-
43
-
44
-
45
-
46
-
47
-
48
-
49
-
50
-
51
-
52
-
53
-
54
-
55
-
56
-
57
-
58
-
59
-
60
-
61
-
62
-
63
-
64
-
65
-
66
-
67
-
68
-
69
-
70
-
71
-
72
-
73
-
74
-
75
-
76
-
77
-
78
-
79
-
80
-
81
-
82
-
83
-
84
-
85
-
86
-
87
-
88
-
89
-
90
-
91
-
92
-
93
-
94
-
95
-
96
-
97
-
98
-
99
-
100
-
101
-
102
-
103
-
104
-
105
-
106
-
107
-
108
-
109
-
110
-
111
-
112
-
113
-
114
-
115
-
116
-
117
-
118
-
119
-
120
-
121
-
122
-
123
-
124
-
125
-
126
-
127
-
128
-
129
-
130
-
131
-
132
-
133
-
134
-
135
-
136
-
137
-
138
-
139
-
140
-
141
-
142
-
143
-
144
-
145
-
146
-
147
-
148
-
 149
149 -
 150
150 -
 151
151 -
 152
152 -
 153
153 -
 154
154 -
 155
155 -
 156
156 -
 157
157 -
 158
158 -
 159
159 -
 160
160 -
 161
161 -
 162
162 -
 163
163 -
 164
164 -
 165
165 -
 166
166 -
 167
167 -
 168
168 -
 169
169 -
170
-
171
-
172
-
173
-
174
-
175
-
176
-
177
-
178
-
179
-
180
-
181
-
182
-
183
-
184
-
185
-
186
-
187
-
188
-
189
-
190
-
191
-
192
-
193
-
194
-
195
-
196
-
197
-
198
-
199
-
200
-
201
-
202
-
203
-
204
-
205
-
206
-
207
-
208
-
209
-
210
-
211
-
212
-
213
-
214
-
215
-
216
-
217
-
218
-
219
-
220
-
221
-
222
-
223
-
224
-
225
-
226
-
227
-
228
-
229
-
230
-
231
-
232
-
233
-
234
-
235
-
236
-
237
-
238
-
239
-
240
-
241
-
242
-
243
-
244
-
245
-
246
-
247
-
248
-
249
-
250
-
251
-
252
-
253
-
254
-
255
-
256
-
257
-
258
-
259
-
260
-
261
-
262
-
263
-
264
-
265
-
266
-
267
-
268
-
269
-
270
-
271
-
272
-
273
-
274
-
275
-
276
 |
 |

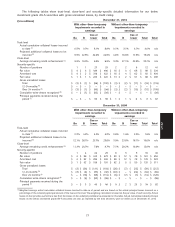
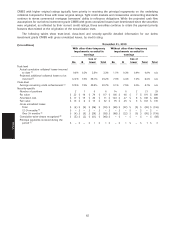
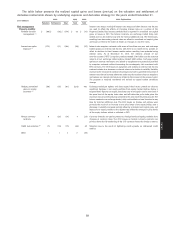
collateral and securitization trust financial positions, and demonstrate our recorded impairments and that the remaining
unrealized losses on these positions are temporary.
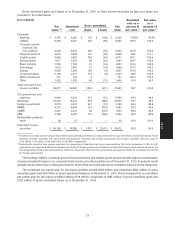
The following tables show trust-level, class-level and security-specific detailed information for our below
investment grade Subprime securities with gross unrealized losses that are not reliably insured, by credit rating.
December 31, 2010
($ in millions)
With other-than-temporary Without other-than-temporary
impairments recorded in impairments recorded in
earnings earnings
Caa or Caa or
Ba B lower Total Ba B lower Total Total
Trust-level
Actual cumulative collateral losses incurred
to date (1) —% 12.0% 16.1% 16.0% 13.2% 12.5% 12.6% 12.7% n/a
Projected additional collateral losses to be
incurred (2) —% 38.2% 43.2% 43.0% 46.5% 42.7% 40.8% 42.1% n/a
Class-level
Average remaining credit enhancement (3) —% 26.0% 22.6% 22.8% 72.7% 63.6% 50.5% 56.7% n/a
Security-specific
Number of positions — 5 81 86 11 10 35 56 142
Par value $ — $ 42 $ 952 $ 994 $ 73 $ 69 $ 265 $ 407 $ 1,401
Amortized cost $ — $ 33 $ 650 $ 683 $ 73 $ 69 $ 265 $ 407 $ 1,090
Fair value $ — $ 21 $ 425 $ 446 $ 62 $ 54 $ 158 $ 274 $ 720
Gross unrealized losses
Total $ — $ (12) $ (225) $ (237) $ (11) $ (15) $ (107) $ (133) $ (370)
12-24 months (4) $ — $ — $ (9) $ (9) $ — $ — $ — $ — $ (9)
Over 24 months (5) $ — $ (12) $ (216) $ (228) $ (11) $ (15) $ (107) $ (133) $ (361)
Cumulative write-downs recognized (6) $ — $ (9) $ (293) $ (302) $ — $ — $ — $ — $ (302)
Principal payments received during the
period (7) $—$4$62$66$18$ 4$11$33$ 99
December 31, 2009
With other-than-temporary Without other-than-temporary
impairments recorded in impairments recorded in
earnings earnings
Caa or Caa or
Ba B lower Total Ba B lower Total Total
Trust-level
Actual cumulative collateral losses
incurred to date (1) 15.0% 13.8% 17.2% 16.9% 8.8% 8.1% 9.5% 9.1% n/a
Projected additional collateral losses to
be incurred (2) 41.2% 33.5% 46.2% 45.2% 36.5% 35.3% 40.0% 38.2% n/a
Class-level
Average remaining credit enhancement (3) 38.1% 30.1% 38.6% 38.0% 49.6% 45.4% 42.6% 45.4% n/a
Security-specific
Number of positions 1 4 53 58 20 13 37 70 128
Par value $ 30 $ 52 $ 798 $ 880 $ 213 $ 59 $ 315 $ 587 $ 1,467
Amortized cost $ 24 $ 48 $ 581 $ 653 $ 213 $ 59 $ 314 $ 586 $ 1,239
Fair value $ 10 $ 28 $ 230 $ 268 $ 112 $ 32 $ 144 $ 288 $ 556
Gross unrealized losses
Total $ (14) $ (20) $ (351) $ (385) $ (101) $ (27) $ (170) $ (298) $ (683)
12-24 months (4) $ — $ (4) $ (53) $ (57) $ (2) $ (1) $ — $ (3) $ (60)
Over 24 months (5) $ (14) $ (12) $ (294) $ (320) $ (99) $ (26) $ (170) $ (295) $ (615)
Cumulative write-downs recognized (6) $ (6) $ (4) $ (217) $ (227) $ — $ — $ — $ — $ (227)
Principal payments received during the
period (7) $ — $ 13 $ 40 $ 53 $ 17 $ 11 $ 33 $ 61 $ 114
(1) Weighted average actual cumulative collateral losses incurred to date as of period end are based on the actual principal losses incurred as a
percentage of the remaining principal amount of the loans in the trust. The weighting calculation is based on the par value of each security. Actual
79
MD&A