Allstate 2011 Annual Report Download - page 45
Download and view the complete annual report
Please find page 45 of the 2011 Allstate annual report below. You can navigate through the pages in the report by either clicking on the pages listed below, or by using the keyword search tool below to find specific information within the annual report.-
 1
1 -
2
-
3
-
4
-
5
-
6
-
7
-
8
-
9
-
10
-
11
-
12
-
13
-
14
-
15
-
16
-
17
-
18
-
19
-
20
-
21
-
22
-
23
-
24
-
25
-
26
-
27
-
28
-
29
-
30
-
31
-
32
-
33
-
34
-
 35
35 -
 36
36 -
 37
37 -
 38
38 -
 39
39 -
 40
40 -
 41
41 -
 42
42 -
 43
43 -
 44
44 -
 45
45 -
 46
46 -
 47
47 -
 48
48 -
 49
49 -
 50
50 -
 51
51 -
 52
52 -
 53
53 -
 54
54 -
 55
55 -
56
-
57
-
58
-
59
-
60
-
61
-
62
-
63
-
64
-
65
-
66
-
67
-
68
-
69
-
70
-
71
-
72
-
73
-
74
-
75
-
76
-
77
-
78
-
79
-
80
-
81
-
82
-
83
-
84
-
85
-
86
-
87
-
88
-
89
-
90
-
91
-
92
-
93
-
94
-
95
-
96
-
97
-
98
-
99
-
100
-
101
-
102
-
103
-
104
-
105
-
106
-
107
-
108
-
109
-
110
-
111
-
112
-
113
-
114
-
115
-
116
-
117
-
118
-
119
-
120
-
121
-
122
-
123
-
124
-
125
-
126
-
127
-
128
-
129
-
130
-
131
-
132
-
133
-
134
-
135
-
136
-
137
-
138
-
139
-
140
-
141
-
142
-
143
-
144
-
145
-
146
-
147
-
148
-
149
-
150
-
151
-
152
-
153
-
154
-
155
-
156
-
157
-
158
-
159
-
160
-
161
-
162
-
163
-
164
-
165
-
166
-
167
-
168
-
169
-
170
-
171
-
172
-
173
-
174
-
175
-
176
-
177
-
178
-
179
-
180
-
181
-
182
-
183
-
184
-
185
-
186
-
187
-
188
-
189
-
190
-
191
-
192
-
193
-
194
-
195
-
196
-
197
-
198
-
199
-
200
-
201
-
202
-
203
-
204
-
205
-
206
-
207
-
208
-
209
-
210
-
211
-
212
-
213
-
214
-
215
-
216
-
217
-
218
-
219
-
220
-
221
-
222
-
223
-
224
-
225
-
226
-
227
-
228
-
229
-
230
-
231
-
232
-
233
-
234
-
235
-
236
-
237
-
238
-
239
-
240
-
241
-
242
-
243
-
244
-
245
-
246
-
247
-
248
-
249
-
250
-
251
-
252
-
253
-
254
-
255
-
256
-
257
-
258
-
259
-
260
-
261
-
262
-
263
-
264
-
265
-
266
-
267
-
268
-
269
-
270
-
271
-
272
-
273
-
274
-
275
-
276
 |
 |

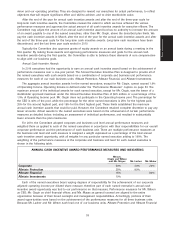
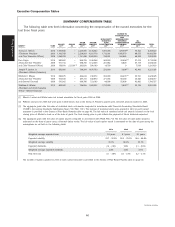
Target award opportunities approved by the Committee are stated as a percentage of annual base salary.
Annual cash incentive awards are calculated using base salary, as adjusted by any merit and promotional
increases granted during the year on a prorated basis. In setting target incentive levels for named executives, the
Committee gives the most consideration to market data primarily focusing on pay levels at peer group companies
with which we directly compete for executive talent and stockholder investment. As a result of leveraging external
market data, Mr. Wilson has the highest target award opportunity of 150%, followed by Messrs. Lacher and
Winter, heads of Allstate Protection and Allstate Financial, respectively, with a target award opportunity of 125%,
followed by Mr. Civgin, our chief financial officer, with a target award opportunity of 100%, followed by
Ms. Mayes, our general counsel, with a target award opportunity of 85%.
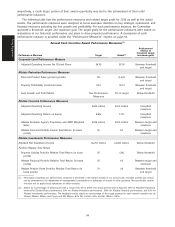
In calculating the annual cash incentive awards, our achievement with respect to each performance measure
is expressed as a percentage of the target goal, with interpolation applied between the threshold and target goals
and between the target and maximum goals. Unless otherwise adjusted by the Committee, the amount of each
named executive’s annual cash incentive award is the sum of the amounts calculated using the calculation below
for all of the performance measures.
Actual performance interpolated X Weighting X Target award opportunity as a X Salary**
relative to threshold and percentage of salary**
target on a range of 50%
to 100% and relative to
target and maximum on
a range of 100% to 250%*
* Actual performance below threshold results in 0%
** Base salary, as adjusted by any merit and promotional increases granted during the year on a prorated basis.
Following the end of the performance year, Mr. Wilson conducted an evaluation of the performance of each
member of his senior management team, including each other named executive. Based on his subjective
evaluation of each executive’s contributions and performance, Mr. Wilson made recommendations to the
Committee regarding individual adjustments to the formula driven annual incentive amounts. The
recommendations were considered and approved by the Committee. The annual cash award for each named
executive for 2010 is based on the plan mechanics, performance results, and individual performance assessments
by the CEO, which reflect progress made against established goals.
●Mr. Civgin. Under Mr. Civgin’s leadership Allstate continued to demonstrate excellent capital management
results, improved its enterprise risk and return practices, and provided strong overall governance. Mr. Civgin
demonstrated strong leadership in winding down Allstate Bank and continued to develop stronger
relationships with Allstate’s shareholders. Mr. Civgin’s annual cash award of $400,000 reflects plan results
and his performance during 2010.
●Mr. Lacher. Allstate Protection’s profitability was within the annual outlook range but was negatively
impacted by high catastrophes and increased auto claim frequency. Momentum gained in new auto
business through a new advertising program was offset by effects of profitability improvement efforts in
several large states. Progress was made in implementing a new organization structure, recruiting new
leadership to the business and improving agency loyalty. Mr. Lacher’s annual cash bonus award of $250,000
is reflective of the plan results and his performance in leading the Allstate Protection business.
●Ms. Mayes. Ms. Mayes continued to drive process improvements and expense management in her
leadership of Allstate’s Law & Regulation department. Ms. Mayes continued to provide expert leadership in
addressing significant regulatory reforms and government relations. Reflective of plan results and her
performance during 2010, Ms. Mayes earned an annual cash award of $350,000.
●Mr. Winter. Allstate Financial’s adjusted operating income and adjusted operating return on equity exceeded
maximum. Allstate Financial continued executing on its strategy to serve its customers by focusing on
Allstate agencies and Allstate Benefits (formerly the Allstate Workplace Division), including the launch of
the new GoodforLifeSM product. Mr. Winter’s leadership re-energized the organization through his strategic
vision and driving performance and accountability. Reflecting plan results and his performance, Mr. Winter’s
annual cash bonus award is $1,212,300.
35
Proxy Statement