Allstate 2011 Annual Report Download - page 44
Download and view the complete annual report
Please find page 44 of the 2011 Allstate annual report below. You can navigate through the pages in the report by either clicking on the pages listed below, or by using the keyword search tool below to find specific information within the annual report.-
 1
1 -
2
-
3
-
4
-
5
-
6
-
7
-
8
-
9
-
10
-
11
-
12
-
13
-
14
-
15
-
16
-
17
-
18
-
19
-
20
-
21
-
22
-
23
-
24
-
25
-
26
-
27
-
28
-
29
-
30
-
31
-
32
-
33
-
 34
34 -
 35
35 -
 36
36 -
 37
37 -
 38
38 -
 39
39 -
 40
40 -
 41
41 -
 42
42 -
 43
43 -
 44
44 -
 45
45 -
 46
46 -
 47
47 -
 48
48 -
 49
49 -
 50
50 -
 51
51 -
 52
52 -
 53
53 -
 54
54 -
55
-
56
-
57
-
58
-
59
-
60
-
61
-
62
-
63
-
64
-
65
-
66
-
67
-
68
-
69
-
70
-
71
-
72
-
73
-
74
-
75
-
76
-
77
-
78
-
79
-
80
-
81
-
82
-
83
-
84
-
85
-
86
-
87
-
88
-
89
-
90
-
91
-
92
-
93
-
94
-
95
-
96
-
97
-
98
-
99
-
100
-
101
-
102
-
103
-
104
-
105
-
106
-
107
-
108
-
109
-
110
-
111
-
112
-
113
-
114
-
115
-
116
-
117
-
118
-
119
-
120
-
121
-
122
-
123
-
124
-
125
-
126
-
127
-
128
-
129
-
130
-
131
-
132
-
133
-
134
-
135
-
136
-
137
-
138
-
139
-
140
-
141
-
142
-
143
-
144
-
145
-
146
-
147
-
148
-
149
-
150
-
151
-
152
-
153
-
154
-
155
-
156
-
157
-
158
-
159
-
160
-
161
-
162
-
163
-
164
-
165
-
166
-
167
-
168
-
169
-
170
-
171
-
172
-
173
-
174
-
175
-
176
-
177
-
178
-
179
-
180
-
181
-
182
-
183
-
184
-
185
-
186
-
187
-
188
-
189
-
190
-
191
-
192
-
193
-
194
-
195
-
196
-
197
-
198
-
199
-
200
-
201
-
202
-
203
-
204
-
205
-
206
-
207
-
208
-
209
-
210
-
211
-
212
-
213
-
214
-
215
-
216
-
217
-
218
-
219
-
220
-
221
-
222
-
223
-
224
-
225
-
226
-
227
-
228
-
229
-
230
-
231
-
232
-
233
-
234
-
235
-
236
-
237
-
238
-
239
-
240
-
241
-
242
-
243
-
244
-
245
-
246
-
247
-
248
-
249
-
250
-
251
-
252
-
253
-
254
-
255
-
256
-
257
-
258
-
259
-
260
-
261
-
262
-
263
-
264
-
265
-
266
-
267
-
268
-
269
-
270
-
271
-
272
-
273
-
274
-
275
-
276
 |
 |

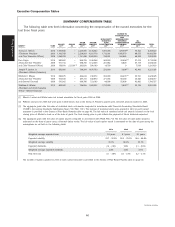
respectively, a much larger portion of their award opportunity was tied to the achievement of their units’
performance measures.
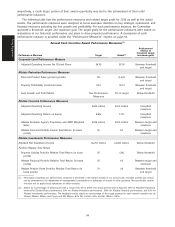
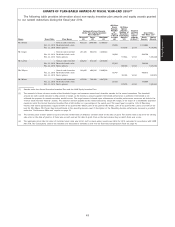
The following table lists the performance measures and related target goals for 2010 as well as the actual
results. The performance measures were designed to focus executive attention on key strategic, operational, and
financial measures including top line growth and profitability. For each performance measure, the Committee
approved a threshold, target, and maximum goal. The target goals for the performance measures were based on
evaluations of our historical performance and plans to drive projected performance. A description of each
performance measure is provided under the ‘‘Performance Measures’’ caption on page 53.
Annual Cash Incentive Award Performance Measures(1)
Achievement
relative to
threshold, target,
Performance Measure Target Actual(2) maximum goals
Corporate-Level Performance Measure
Adjusted Operating Income Per Diluted Share $4.30 $3.00 Between threshold
and target
Allstate Protection Performance Measures
Financial Product Sales (percent growth) 0% (3.4)% Between threshold
and target
Property Profitability (combined ratio) 97.4 102.3 Between threshold
and target
Auto Growth and Profit Matrix See Performance 0% of target Below threshold
Measures
Allstate Financial Performance Measures
Adjusted Operating Income $425 million $474 million Exceeded
maximum
Adjusted Operating Return on Equity 6.6% 7.7% Exceeded
maximum
Allstate Exclusive Agency Proprietary and AWD Weighted $256 million $262 million Between target and
Sales maximum
Allstate Financial Portfolio Excess Total Return (in basis 55 63 Between target and
points) maximum
Allstate Investments Performance Measures
Adjusted Net Investment Income $4,257 million $4,090 million Below threshold
Portfolio Relative Total Return
Property Liability Portfolio Relative Total Return (in basis 55 (39) Below threshold
points)
Allstate Financial Portfolio Relative Total Return (in basis 55 63 Between target and
points) maximum
Allstate Pension Plans Portfolio Relative Total Return (in 70 36 Between threshold
basis points) and target
(1) Information regarding our performance measures is disclosed in the limited context of our annual cash incentive awards and should
not be understood to be statements of management’s expectations or estimates of results or other guidance. We specifically caution
investors not to apply these statements to other contexts.
(2) Stated as a percentage of target goals with a range from 0% to 250%, the actual performance comprises 54% for Adjusted Operating
Income Per Diluted Share performance, 39% for Allstate Protection performance, 189% for Allstate Financial performance, and 39% for
Allstate Investments performance. The weighted results stated as a percentage of the target payouts for each named executive are as
follows: Messrs. Wilson and Civgin and Ms. Mayes—67%, Mr. Lacher—42%, and Mr. Winter—162%.
34
Proxy Statement