Allstate 2011 Annual Report Download - page 190
Download and view the complete annual report
Please find page 190 of the 2011 Allstate annual report below. You can navigate through the pages in the report by either clicking on the pages listed below, or by using the keyword search tool below to find specific information within the annual report.-
 1
1 -
2
-
3
-
4
-
5
-
6
-
7
-
8
-
9
-
10
-
11
-
12
-
13
-
14
-
15
-
16
-
17
-
18
-
19
-
20
-
21
-
22
-
23
-
24
-
25
-
26
-
27
-
28
-
29
-
30
-
31
-
32
-
33
-
34
-
35
-
36
-
37
-
38
-
39
-
40
-
41
-
42
-
43
-
44
-
45
-
46
-
47
-
48
-
49
-
50
-
51
-
52
-
53
-
54
-
55
-
56
-
57
-
58
-
59
-
60
-
61
-
62
-
63
-
64
-
65
-
66
-
67
-
68
-
69
-
70
-
71
-
72
-
73
-
74
-
75
-
76
-
77
-
78
-
79
-
80
-
81
-
82
-
83
-
84
-
85
-
86
-
87
-
88
-
89
-
90
-
91
-
92
-
93
-
94
-
95
-
96
-
97
-
98
-
99
-
100
-
101
-
102
-
103
-
104
-
105
-
106
-
107
-
108
-
109
-
110
-
111
-
112
-
113
-
114
-
115
-
116
-
117
-
118
-
119
-
120
-
121
-
122
-
123
-
124
-
125
-
126
-
127
-
128
-
129
-
130
-
131
-
132
-
133
-
134
-
135
-
136
-
137
-
138
-
139
-
140
-
141
-
142
-
143
-
144
-
145
-
146
-
147
-
148
-
149
-
150
-
151
-
152
-
153
-
154
-
155
-
156
-
157
-
158
-
159
-
160
-
161
-
162
-
163
-
164
-
165
-
166
-
167
-
168
-
169
-
170
-
171
-
172
-
173
-
174
-
175
-
176
-
177
-
178
-
179
-
 180
180 -
 181
181 -
 182
182 -
 183
183 -
 184
184 -
 185
185 -
 186
186 -
 187
187 -
 188
188 -
 189
189 -
 190
190 -
 191
191 -
 192
192 -
 193
193 -
 194
194 -
 195
195 -
 196
196 -
 197
197 -
 198
198 -
 199
199 -
 200
200 -
201
-
202
-
203
-
204
-
205
-
206
-
207
-
208
-
209
-
210
-
211
-
212
-
213
-
214
-
215
-
216
-
217
-
218
-
219
-
220
-
221
-
222
-
223
-
224
-
225
-
226
-
227
-
228
-
229
-
230
-
231
-
232
-
233
-
234
-
235
-
236
-
237
-
238
-
239
-
240
-
241
-
242
-
243
-
244
-
245
-
246
-
247
-
248
-
249
-
250
-
251
-
252
-
253
-
254
-
255
-
256
-
257
-
258
-
259
-
260
-
261
-
262
-
263
-
264
-
265
-
266
-
267
-
268
-
269
-
270
-
271
-
272
-
273
-
274
-
275
-
276
 |
 |

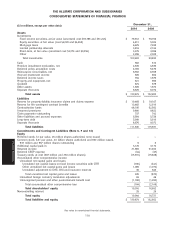
THE ALLSTATE CORPORATION AND SUBSIDIARIES
CONSOLIDATED STATEMENTS OF FINANCIAL POSITION
December 31,
($ in millions, except par value data)
2010 2009
Assets
Investments
Fixed income securities, at fair value (amortized cost $78,786 and $81,243) $ 79,612 $ 78,766
Equity securities, at fair value (cost $4,228 and $4,845) 4,811 5,024
Mortgage loans 6,679 7,935
Limited partnership interests 3,816 2,744
Short-term, at fair value (amortized cost $3,279 and $3,056) 3,279 3,056
Other 2,286 2,308
Total investments 100,483 99,833
Cash 562 612
Premium installment receivables, net 4,839 4,839
Deferred policy acquisition costs 4,769 5,470
Reinsurance recoverables, net 6,552 6,355
Accrued investment income 809 864
Deferred income taxes 784 1,870
Property and equipment, net 921 990
Goodwill 874 875
Other assets 1,605 1,872
Separate Accounts 8,676 9,072
Total assets $ 130,874 $ 132,652
Liabilities
Reserve for property-liability insurance claims and claims expense $ 19,468 $ 19,167
Reserve for life-contingent contract benefits 13,482 12,910
Contractholder funds 48,195 52,582
Unearned premiums 9,800 9,822
Claim payments outstanding 737 742
Other liabilities and accrued expenses 5,564 5,726
Long-term debt 5,908 5,910
Separate Accounts 8,676 9,072
Total liabilities 111,830 115,931
Commitments and Contingent Liabilities (Note 6, 7 and 13)
Equity
Preferred stock, $1 par value, 25 million shares authorized, none issued — —
Common stock, $.01 par value, 2.0 billion shares authorized and 900 million issued,
533 million and 537 million shares outstanding 9 9
Additional capital paid-in 3,176 3,172
Retained income 31,969 31,492
Deferred ESOP expense (44) (47)
Treasury stock, at cost (367 million and 363 million shares) (15,910) (15,828)
Accumulated other comprehensive income:
Unrealized net capital gains and losses:
Unrealized net capital losses on fixed income securities with OTTI (190) (441)
Other unrealized net capital gains and losses 1,089 (1,072)
Unrealized adjustment to DAC, DSI and insurance reserves 36 643
Total unrealized net capital gains and losses 935 (870)
Unrealized foreign currency translation adjustments 69 46
Unrecognized pension and other postretirement benefit cost (1,188) (1,282)
Total accumulated other comprehensive loss (184) (2,106)
Total shareholders’ equity 19,016 16,692
Noncontrolling interest 28 29
Total equity 19,044 16,721
Total liabilities and equity $ 130,874 $ 132,652
See notes to consolidated financial statements.
110
Financial Statements